
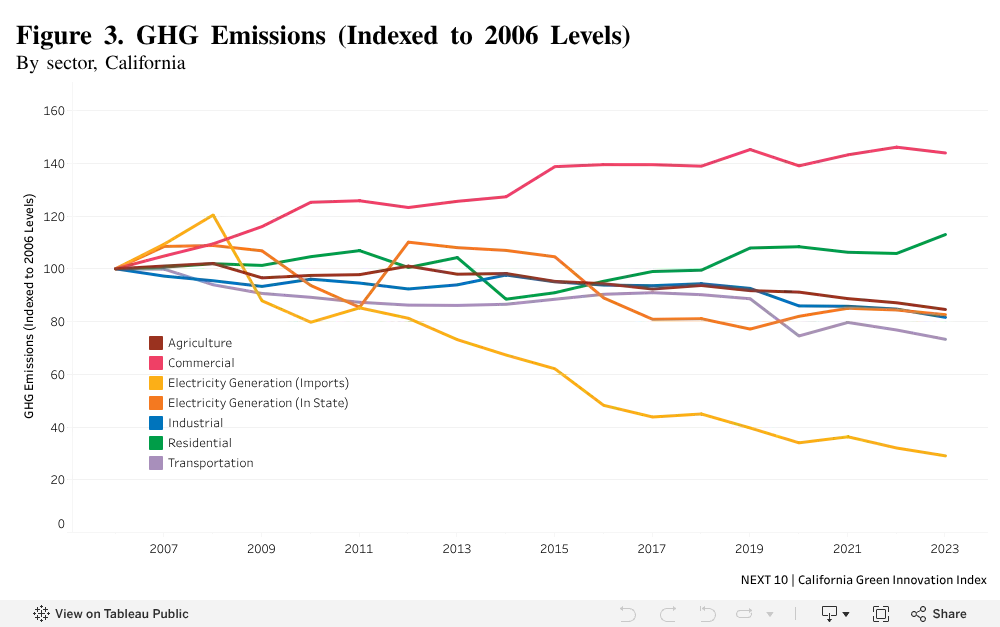
Data Source: California Air Resources Board, California Greenhouse Gas Inventory - by Economic Sector and Activity
Analysis by CEC Economics
Highlight
- From 2006 to 2023, the electric power (imports) sector led with the most substantial percentage emissions reduction since 2006 with 70.9% (-38.8 MMTCO2e) followed by the transportation sector, which fell 26.7% (-50.1 MMTCO2e). Emissions fell at a similar pace in the agriculture, electric power (in-state generation), and industrial sectors, falling by 15.4% (-5.3 MMTCO2e), 17.4% (-8.7 MMTCO2e), and 18.4% (-17.7 MMTCO2e), respectively. Emissions from the electric power sector overall fell by 45.2% (-47.2 MMTCO2e) from 2006 to 2023.
Challenge
- Every sector has cut their emissions since 2006 except for the commercial and residential sectors, where emissions were 7.2 MMTCO2e (+43.9%) and 4.0 MMTCO2e (+13.0%) higher in 2023, respectively. The lack of progress in these sectors highlights the use of substitutes for ozone-depleting substances’ (SODS) dominance in the sectors’ emissions.
More About
Carbon Economy
Related Content