
Analysis by CEC Economics
Highlight
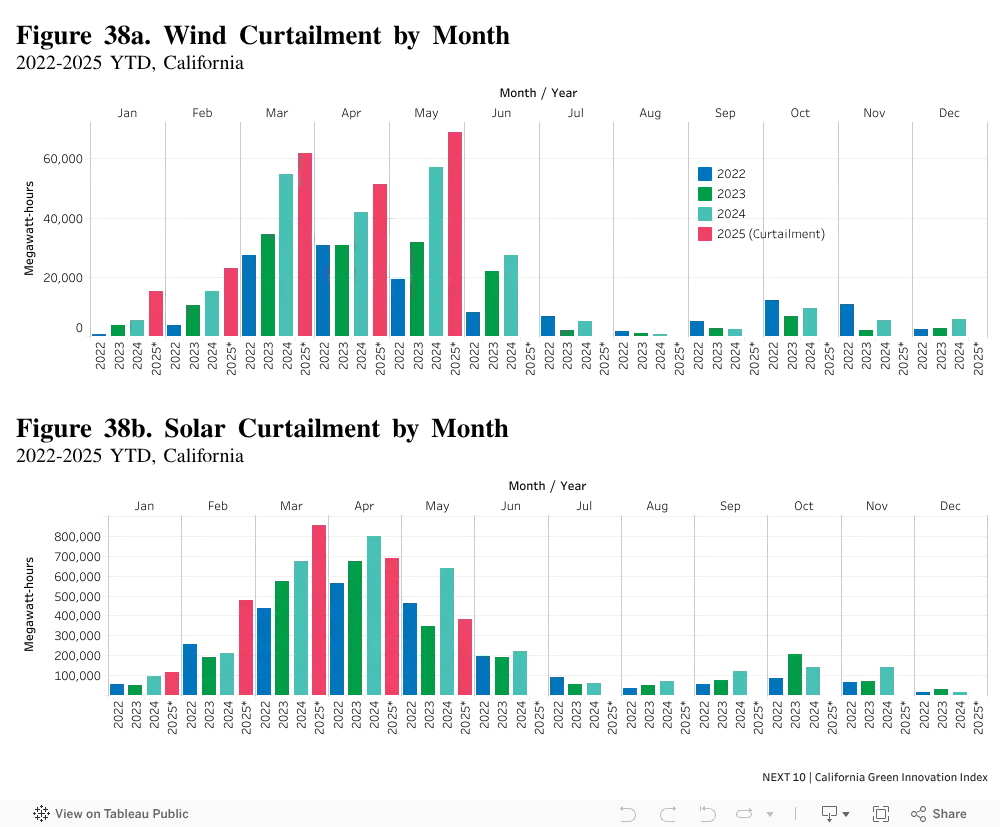
- Although curtailment99 has been increasing, it makes up a small percentage of total in-state generation. In 2024, in-state generation from solar was 50,666 GWh; the curtailment represented 6.3% of in-state generation. Furthermore, solar curtailment from April 2025 and May 2025 (1,070 GWh), which are typically two of the three months with the highest curtailment, trailed behind April 2024 and May 2025 (1,436 GWh). Wind curtailment was 1.5% of in-state generation in 2024, however, that is an increase from 1.1% in 2023. Also, electricity generated from renewable sources tends to be higher when curtailment is also high.
99 Curtailment is the reduction of output of a renewable resource below what it could have otherwise produced. At times power generators may produce output that is not needed. In the absence of energy storage systems, the surplus may have to be dumped, or the power plant output turned down or switched off for a while.
Challenges
- In California, curtailments have been rising every year, driven by growth in solar power to meet the state’s ambitious clean energy goals. As more renewables come online, without robust additional transmission and storage buildout, California faces an increasing amount of wind and solar generation curtailment, especially during the middle of the day (from 10 AM to 2 PM), when there is an oversupply of solar. Solar curtailment levels tend to be highest from March through May. Only about 30% of curtailment is due to oversupply, while the remaining is due to congestion — essentially electricity traffic jams on transmission lines.100
- In the first five months of 2025, curtailment totaled 2,742 GWh electricity generated (220 GWh from wind and 2,521 GWh from solar), which is 5.6% more than the total curtailment of 2,595 GWh in the first five months of 2024. Wind and solar curtailments rose by 26.3% and 4.2%, respectively, during the first five months of 2025 relative to the first five months of 2024. Although curtailment is still rising, the pace has slowed. The 5.6% growth is comparatively moderate; the state curtailed 33.4% more wind and solar during the first five months of 2024 than the first five months of 2023 — curtailing 2,595 GWh and 1,946 GWh during the first five months of 2024 and 2023, respectively.
100 “Feasting on the Glut: Putting Renewable Curtailment in Context.” NRDC. December 4, 2024. Available at: https://www.nrdc.org/bio/mohit-chhabra/feasting-glut-putting-renewable-curtailment-context
More About
Renewable Energy
Related Content