
Data Source: U.S. Energy Information Administration, State Energy Data System (SEDS), U.S. Census Bureau.
Analysis by CEC Economics
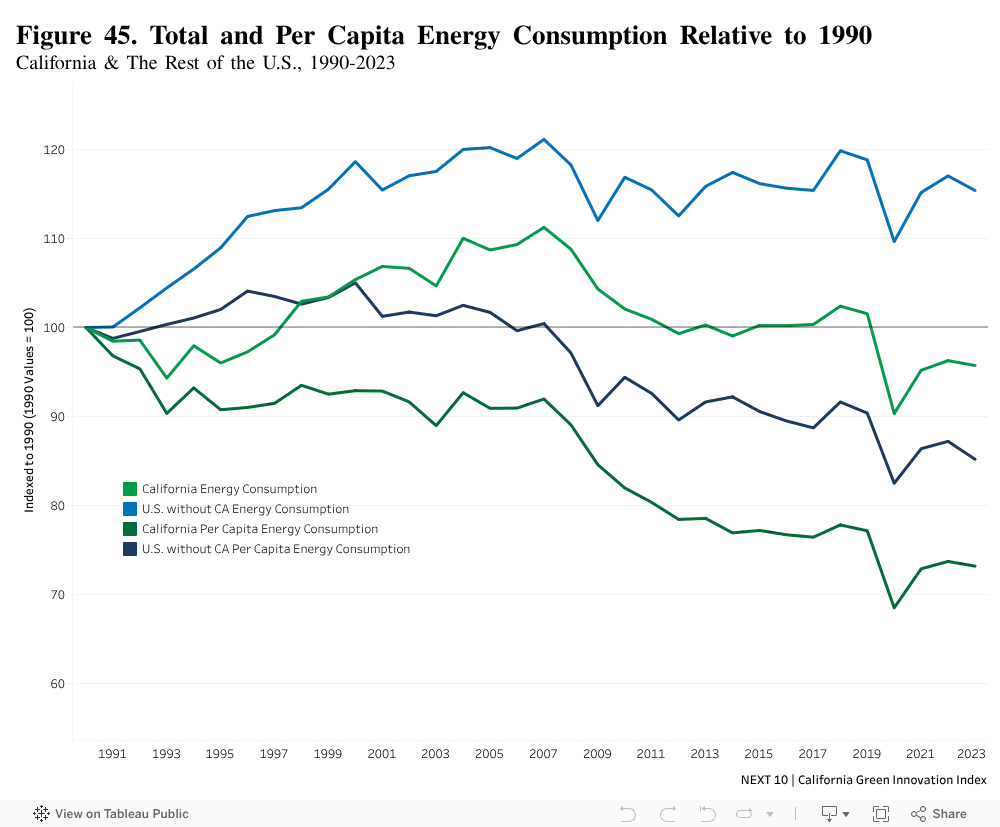
Highlights
- California’s total statewide energy consumption was 4.3% lower in 2023 than in 1990, despite the state being 31% more populous. Energy consumption per capita was 26.8% lower in 2023 than in 1990. By comparison, total and per capita energy consumption for the rest of the U.S. in 2023 were 15.4% higher than in 1990 but fell 1.4% compared to 2022.
- Since climbing back to pre-pandemic levels, California’s energy consumption resumed its declining trend, falling 0.6% in 2023 relative to 2022. Additionally, energy consumption was still 5.7% lower than in 2019. This is largely due to the industrial sector, where energy consumption fell by 13.8% from 2019 to 2023.
More About
Energy Efficiency
Related Content