
Highlights
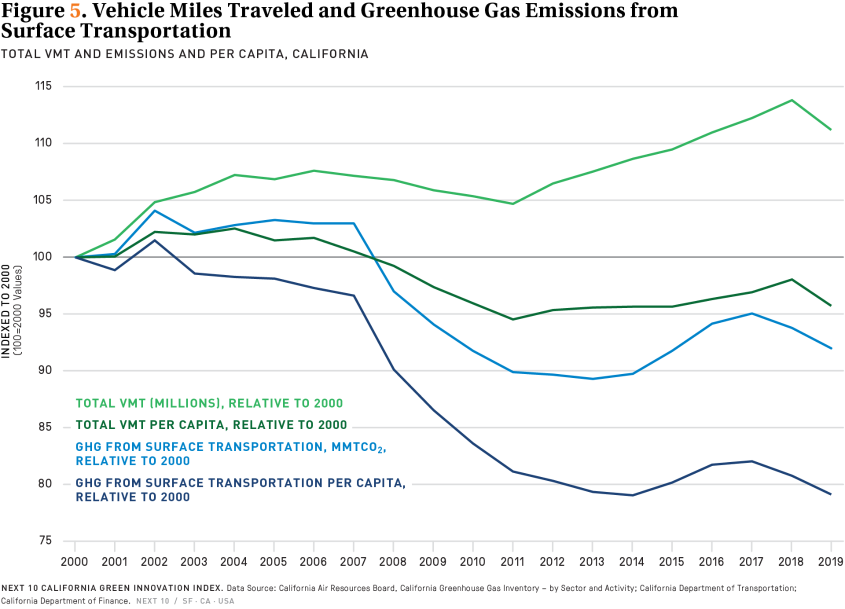
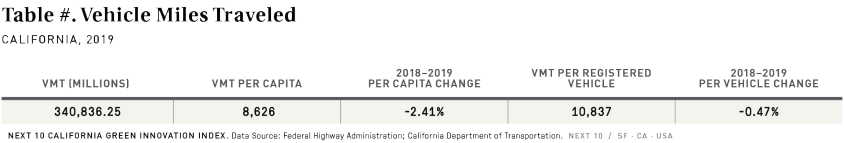
- Vehicle miles traveled (VMT) in California rose 1.4 percent between 2017 and 2018 to 348.8 billion miles. Annual VMT continues to outpace population growth: from 2017 to 2018, California’s population increased 0.3 percent—the lowest it has been during the time period observed—but VMT per capita increased by 1.2 percent during the same period to 8,839 miles per person. From 2010 to 2018, VMT increased on average 1.0 percent per year—slightly faster than population’s average increase of 0.7 percent per year—implying that people are traveling in on-road vehicles more.
- From 2017 to 2018, VMT increased 1.4 percent to 348.8 billion miles, relatively modest compared to the 3.3 percent increase in on-road vehicles registered. While VMT increase outpaced population growth, resulting in a 1.17 percent increase in VMT per capita year-over-year, VMT per registered vehicle declined 1.79 percent. Overall, VMT per registered vehicle has been on a sustained downward trend since 2000, due to the number of vehicles registered far outpacing both population growth and VMT.
Challenges
- VMT has risen faster than population since 2011, resulting in an increasing VMT per capita over time. Population and VMT per capita increased 0.3 percent and 1.4 percent, respectively, while per capita GHG emissions from surface transportation decreased 1.5 percent from 2017 to 2018. Although per capita GHG emissions from surface transportation have somewhat stabilized in recent years at around 19.3 percent below 2000 level, total GHG emissions from surface transportation have been increasing steadily since 2013 to a mere 6.3 percent below 2000 level. Transitioning more drivers to cleaner vehicles and ensuring that future land use decisions minimize VMT will be critical to reducing emissions from this sector.
More About the
Carbon Economy
RELATED CONTENT