
Highlights
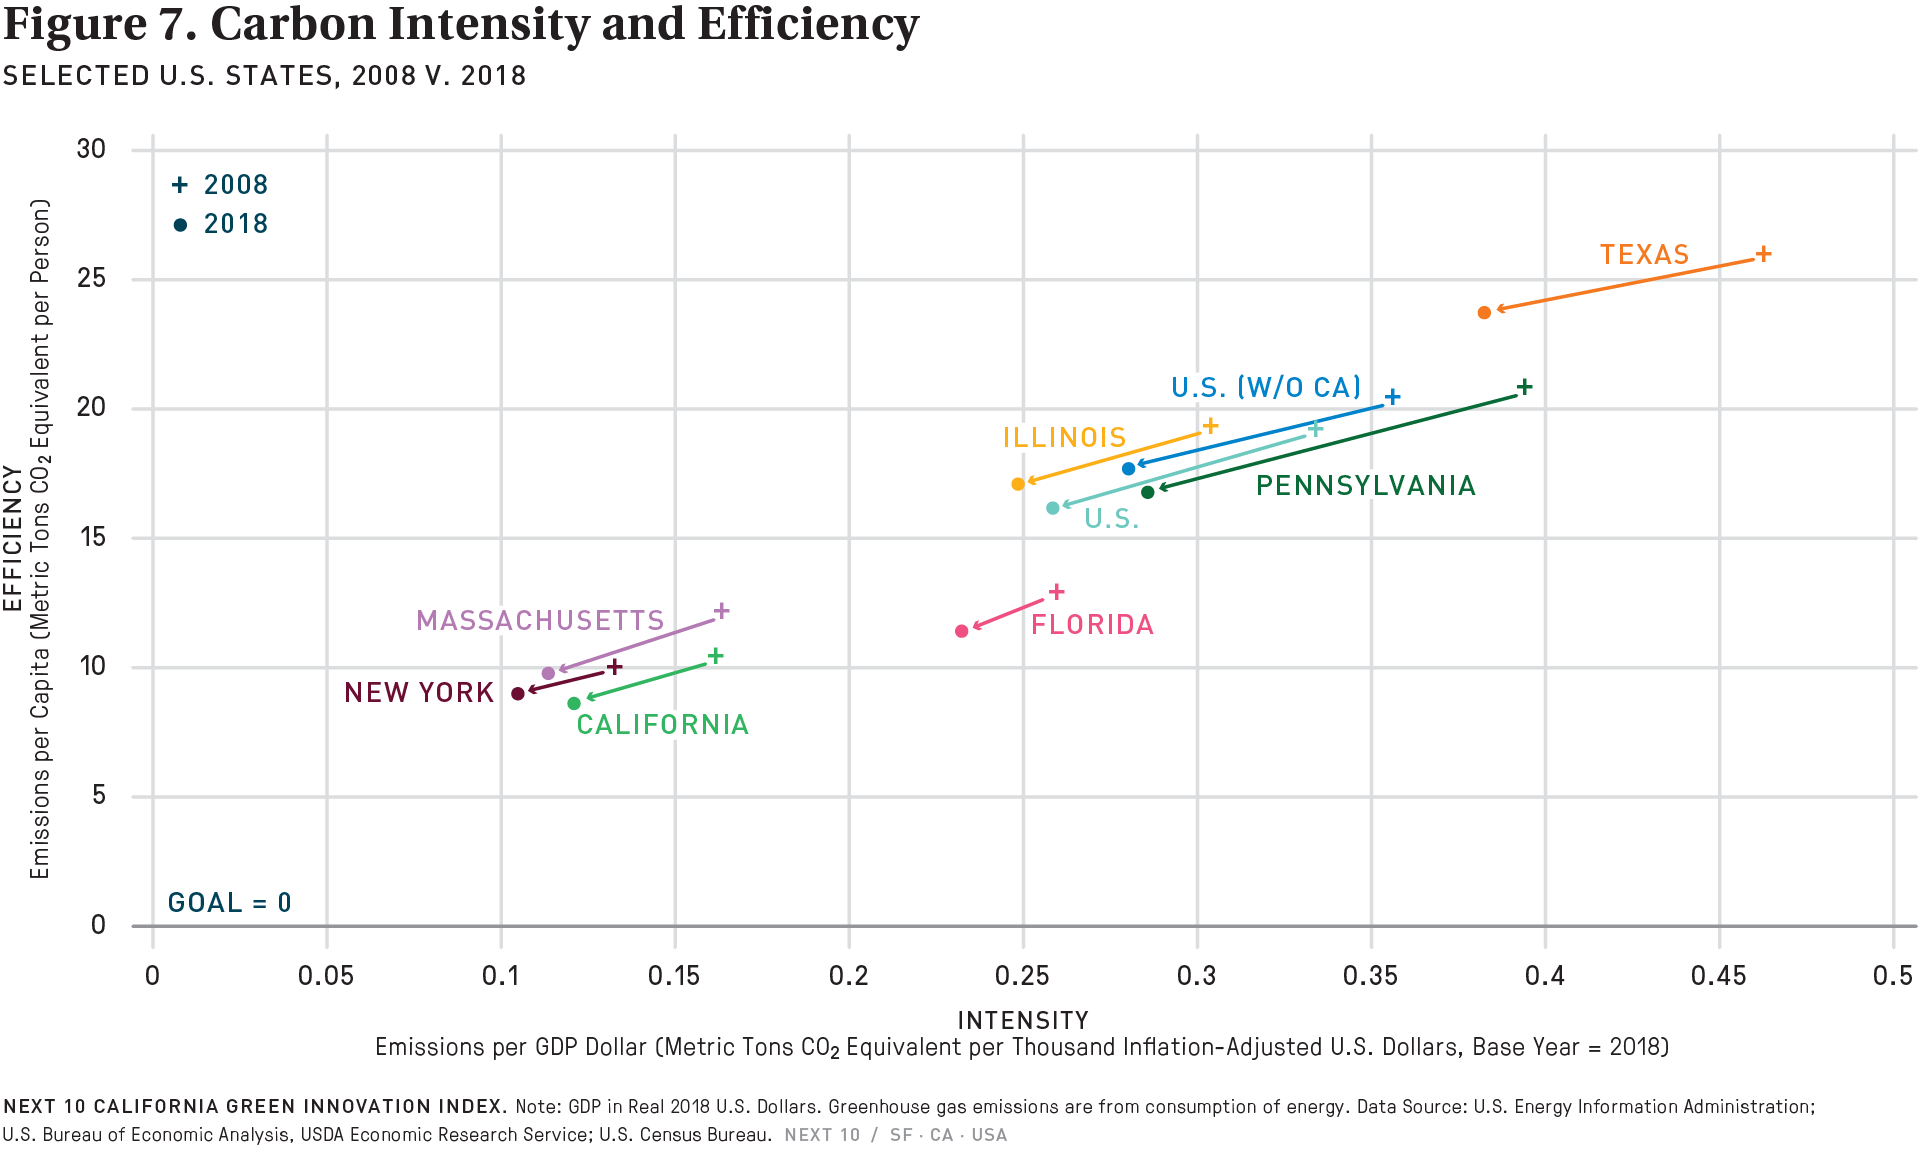
- In 2018 (the latest year for which nationally comparable data are available), $1,000 of economic activity7 in California resulted in 0.120 MTCO2e produced. In comparison, the same $1,000 of economic activity in the U.S. (excluding California) resulted in 0.279 MTCO2e produced—more than double that of California. From 2008 to 2018, California’s energy intensity decreased by 27.7 percent, ahead of the next three most populous states: Texas (-18.8%), Florida (-13.5%) and New York (-25.6%) but behind Pennsylvania (-28.4%) and Massachusetts (-32.3%).
- In addition to performing well in terms of carbon intensity, California also had one of the lowest energy-related GHG emissions per capita levels, with 9.01 MTCO2e per person in 2018, edging out every other big state except for New York (8.98 MTCO2e per person). Comparatively, the U.S. excluding California had a per capita emission of 17.1 MTCO2e which represents an increase from 16.7 MTCO2e per person in 2017.
7 Inflation-adjusted in 2017 dollars.
More About the
Carbon Economy
Related Content