
Highlight
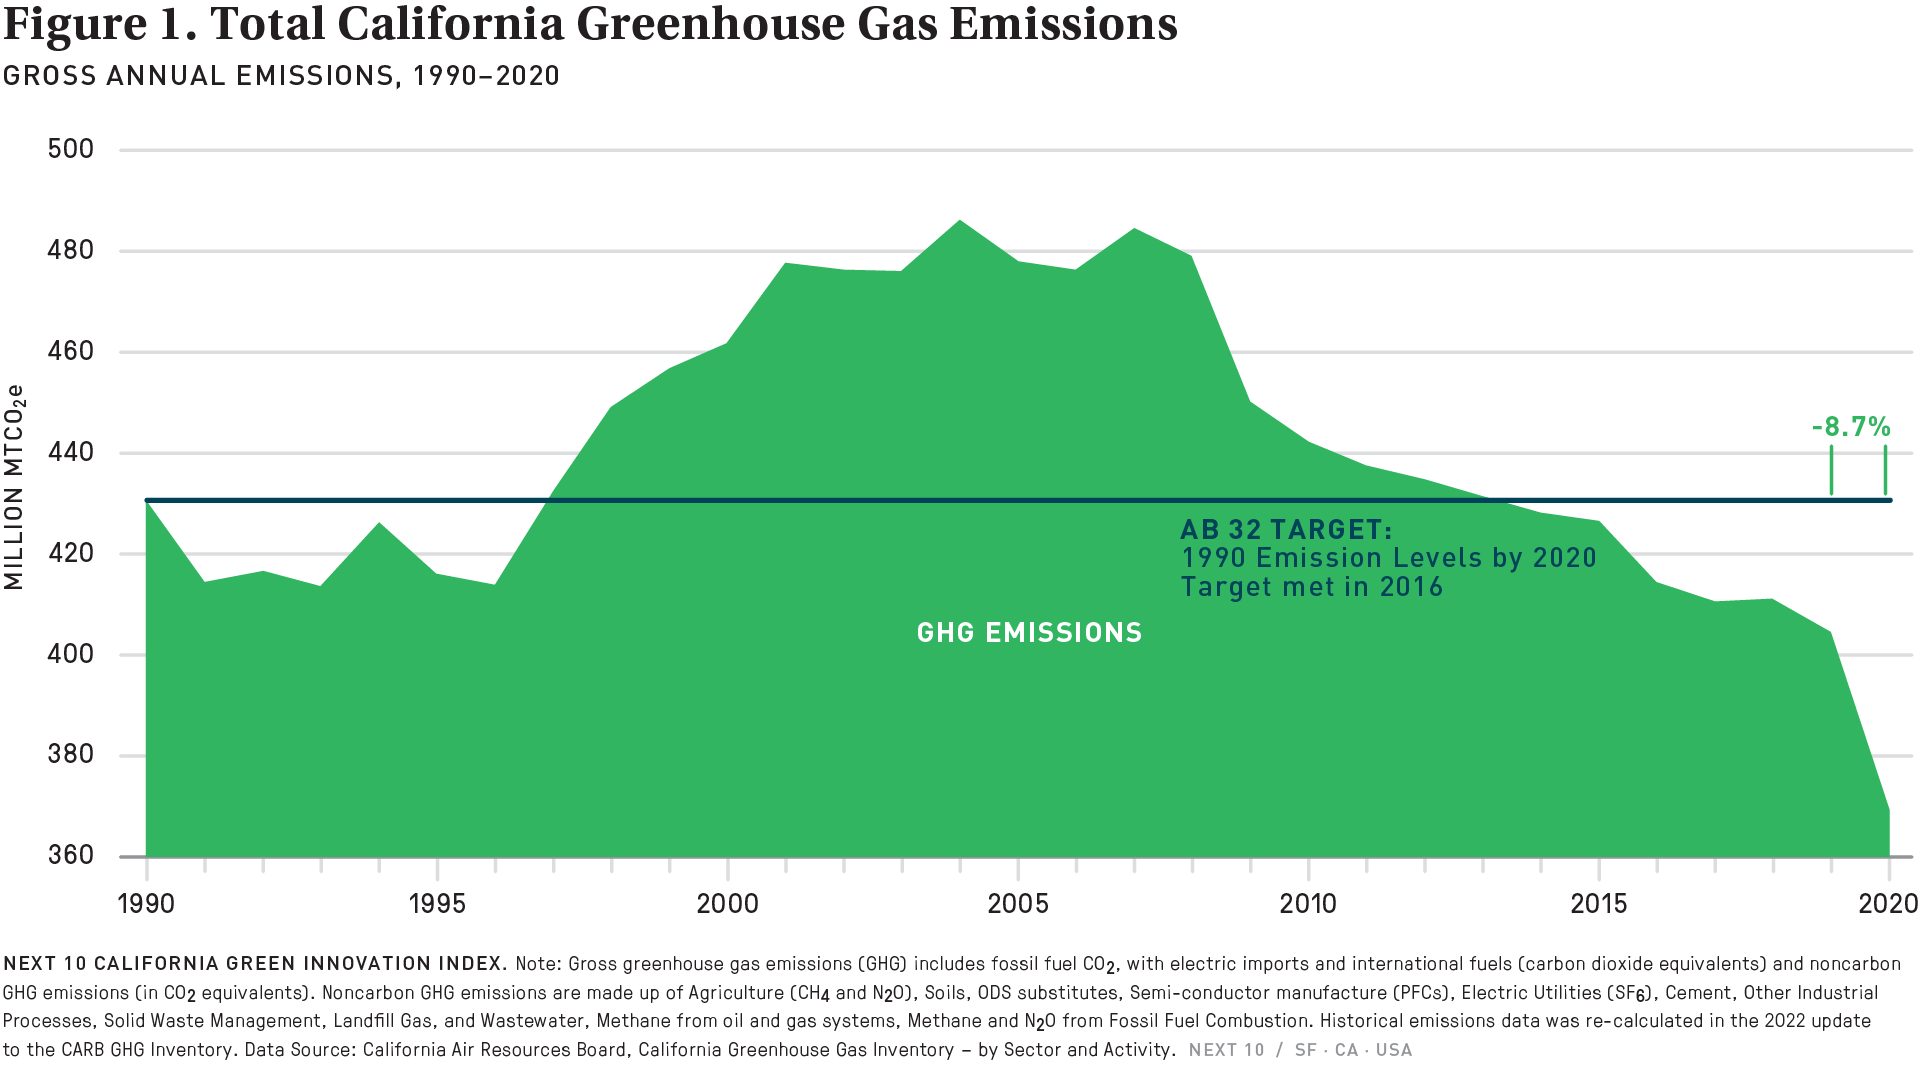
- After meeting the AB 32 goal in 2016, total included greenhouse gas emissions12 were 369.23 MMTCO2e in 2020, or 14.3 percent below the 1990 level of 431 MMTCO2e. GHG emissions decreased by 8.7 percent in 2020 compared to 2019, the most significant percentage decrease since 2010. The transportation sectors contributed the most to the decrease (-26.75 MMTCO2e) followed by the industrial sector (-6.94 MMTCO2e). The electric power sector overall was the biggest contributor of GHG emission decrease in 2019. However, the electricity generation from in-state sources only increased (2.42 MMTCO2e) in 2020 compared to 2019. As extreme heat and droughts continues to worsen, the drop in hydropower was offset by a number of other resources, including natural gas.
121 The GHG inventory was developed in accordance with the Intergovernmental Panel on Climate Change (IPCC) Guidelines for National GHG Inventories, the internationally recognized standard for developing national GHG inventories. Other categories exist besides included emissions: excluded emissions, carbon dioxide from biogenic materials, emissions and removals from forest lands and wood products, and other emissions. Excluded emissions are discussed elsewhere in this chapter. Since the 2021 edition of the inventory (2000 – 2019 emissions), CARB staff have made improvements to emissions estimation methods and incorporated new data sources. More information is available here: https://ww2.arb.ca.gov/sites/default/files/classic/cc/inventory/ghg_inventory_00-20_method_update_document.pdf
More About the
Carbon Economy
Related Content