
Highlights
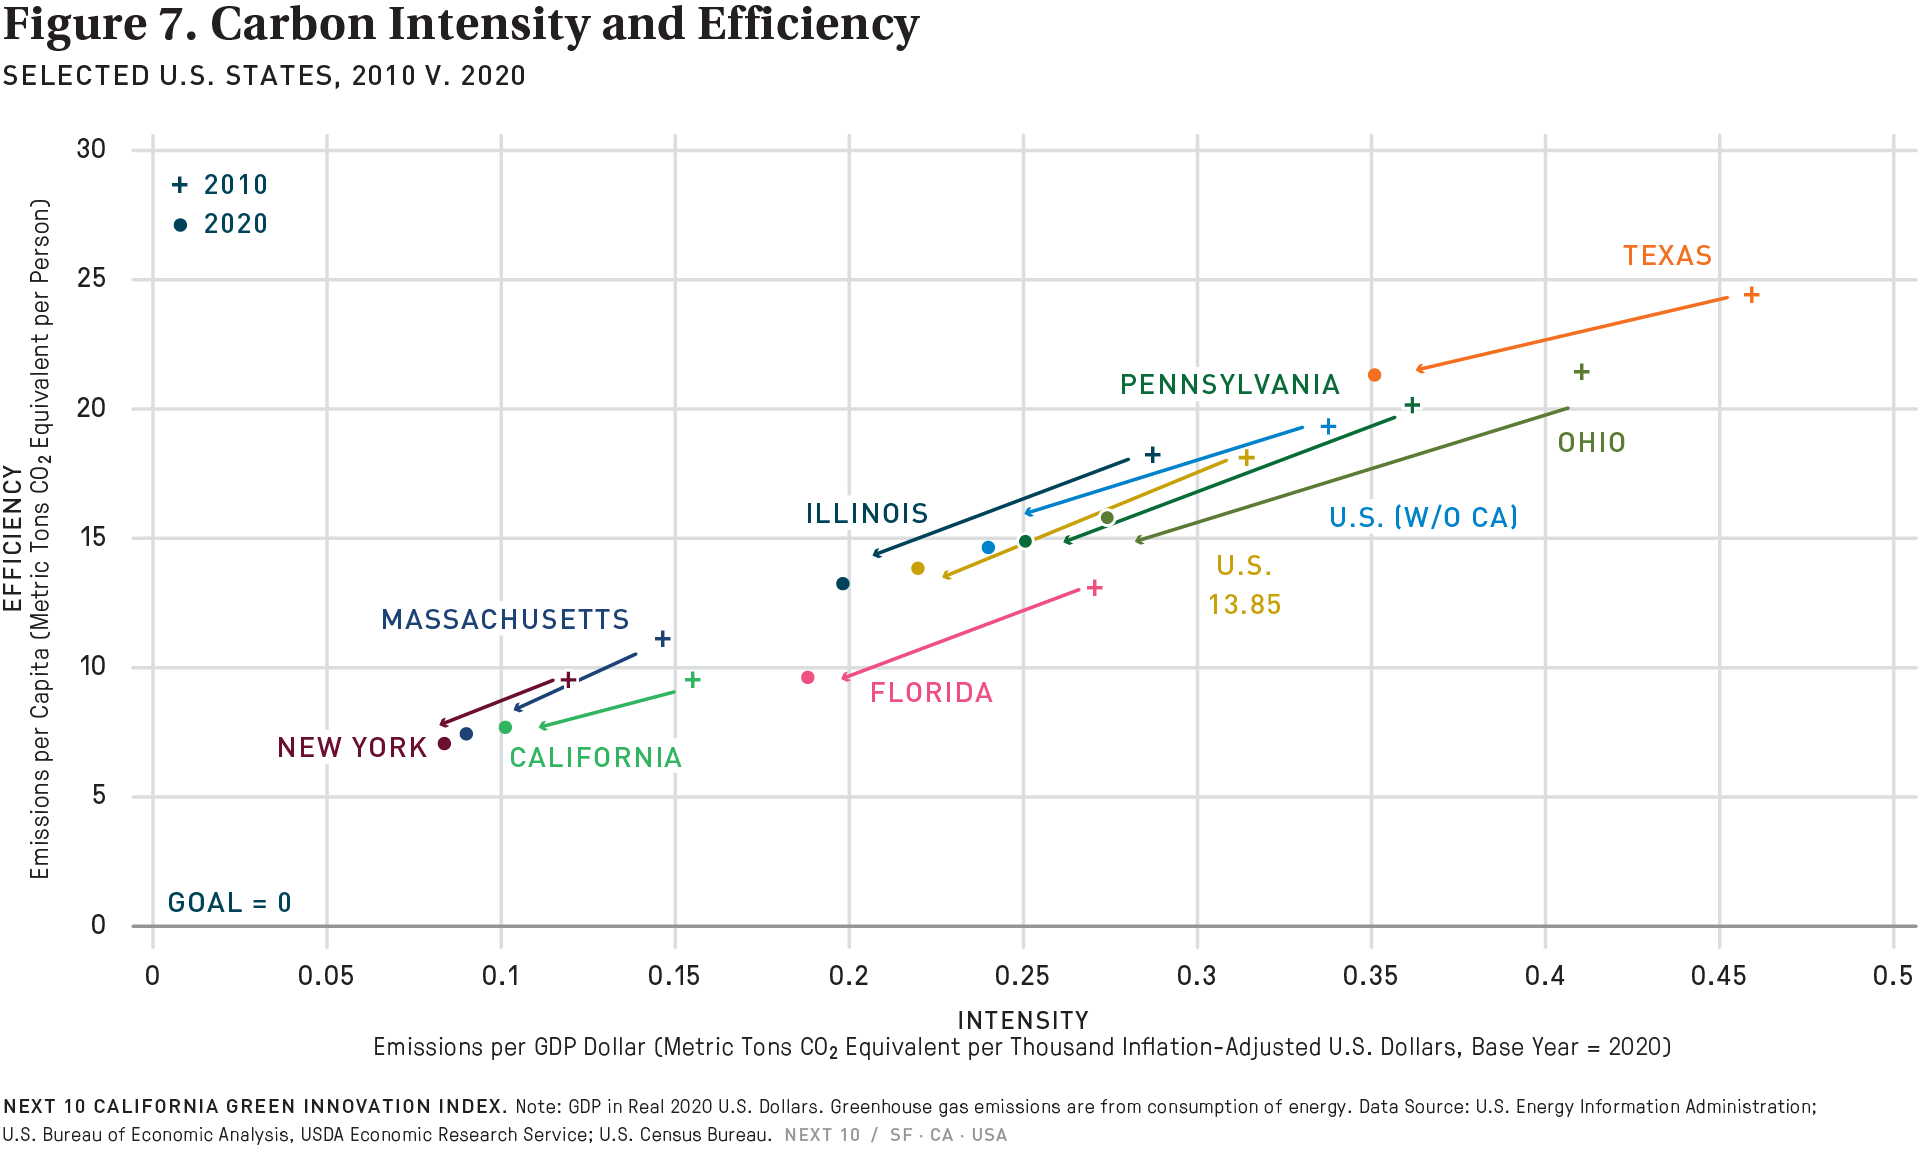
- In 2020, $1,000 of economic activity22 in California resulted in 0.101 MTCO2e produced. In comparison, the same $1,000 of economic activity in the U.S. (excluding California) resulted in 0.24 MTCO2e produced—more than double that of California. From 2010 to 2020, California’s energy intensity decreased by 35.0 percent, ahead of the next four most populous states: New York (-30.3%), Texas (-23.4%), Florida (- 30.6%), Pennsylvania (-30.7%) and Ohio (-33.3%), but behind Massachusetts (-38.7%).
- In addition to performing well in terms of carbon intensity, California also has one of the lowest energy-related GHG emissions per capita levels, with 7.7 MTCO2e per person in 2020. This is lower than every other big state except for Massachusetts (7.4 MTCO2e per person) and New York (7.1 MTCO2e per person). Comparatively, the U.S. excluding California, had a per capita emission of 14.7 MTCO2e, representing a decrease from 16.6 MTCO2e per person in 2019.
22 Inflation-adjusted in 2020 dollars.
More About the
Carbon Economy
Related Content