
Highlight
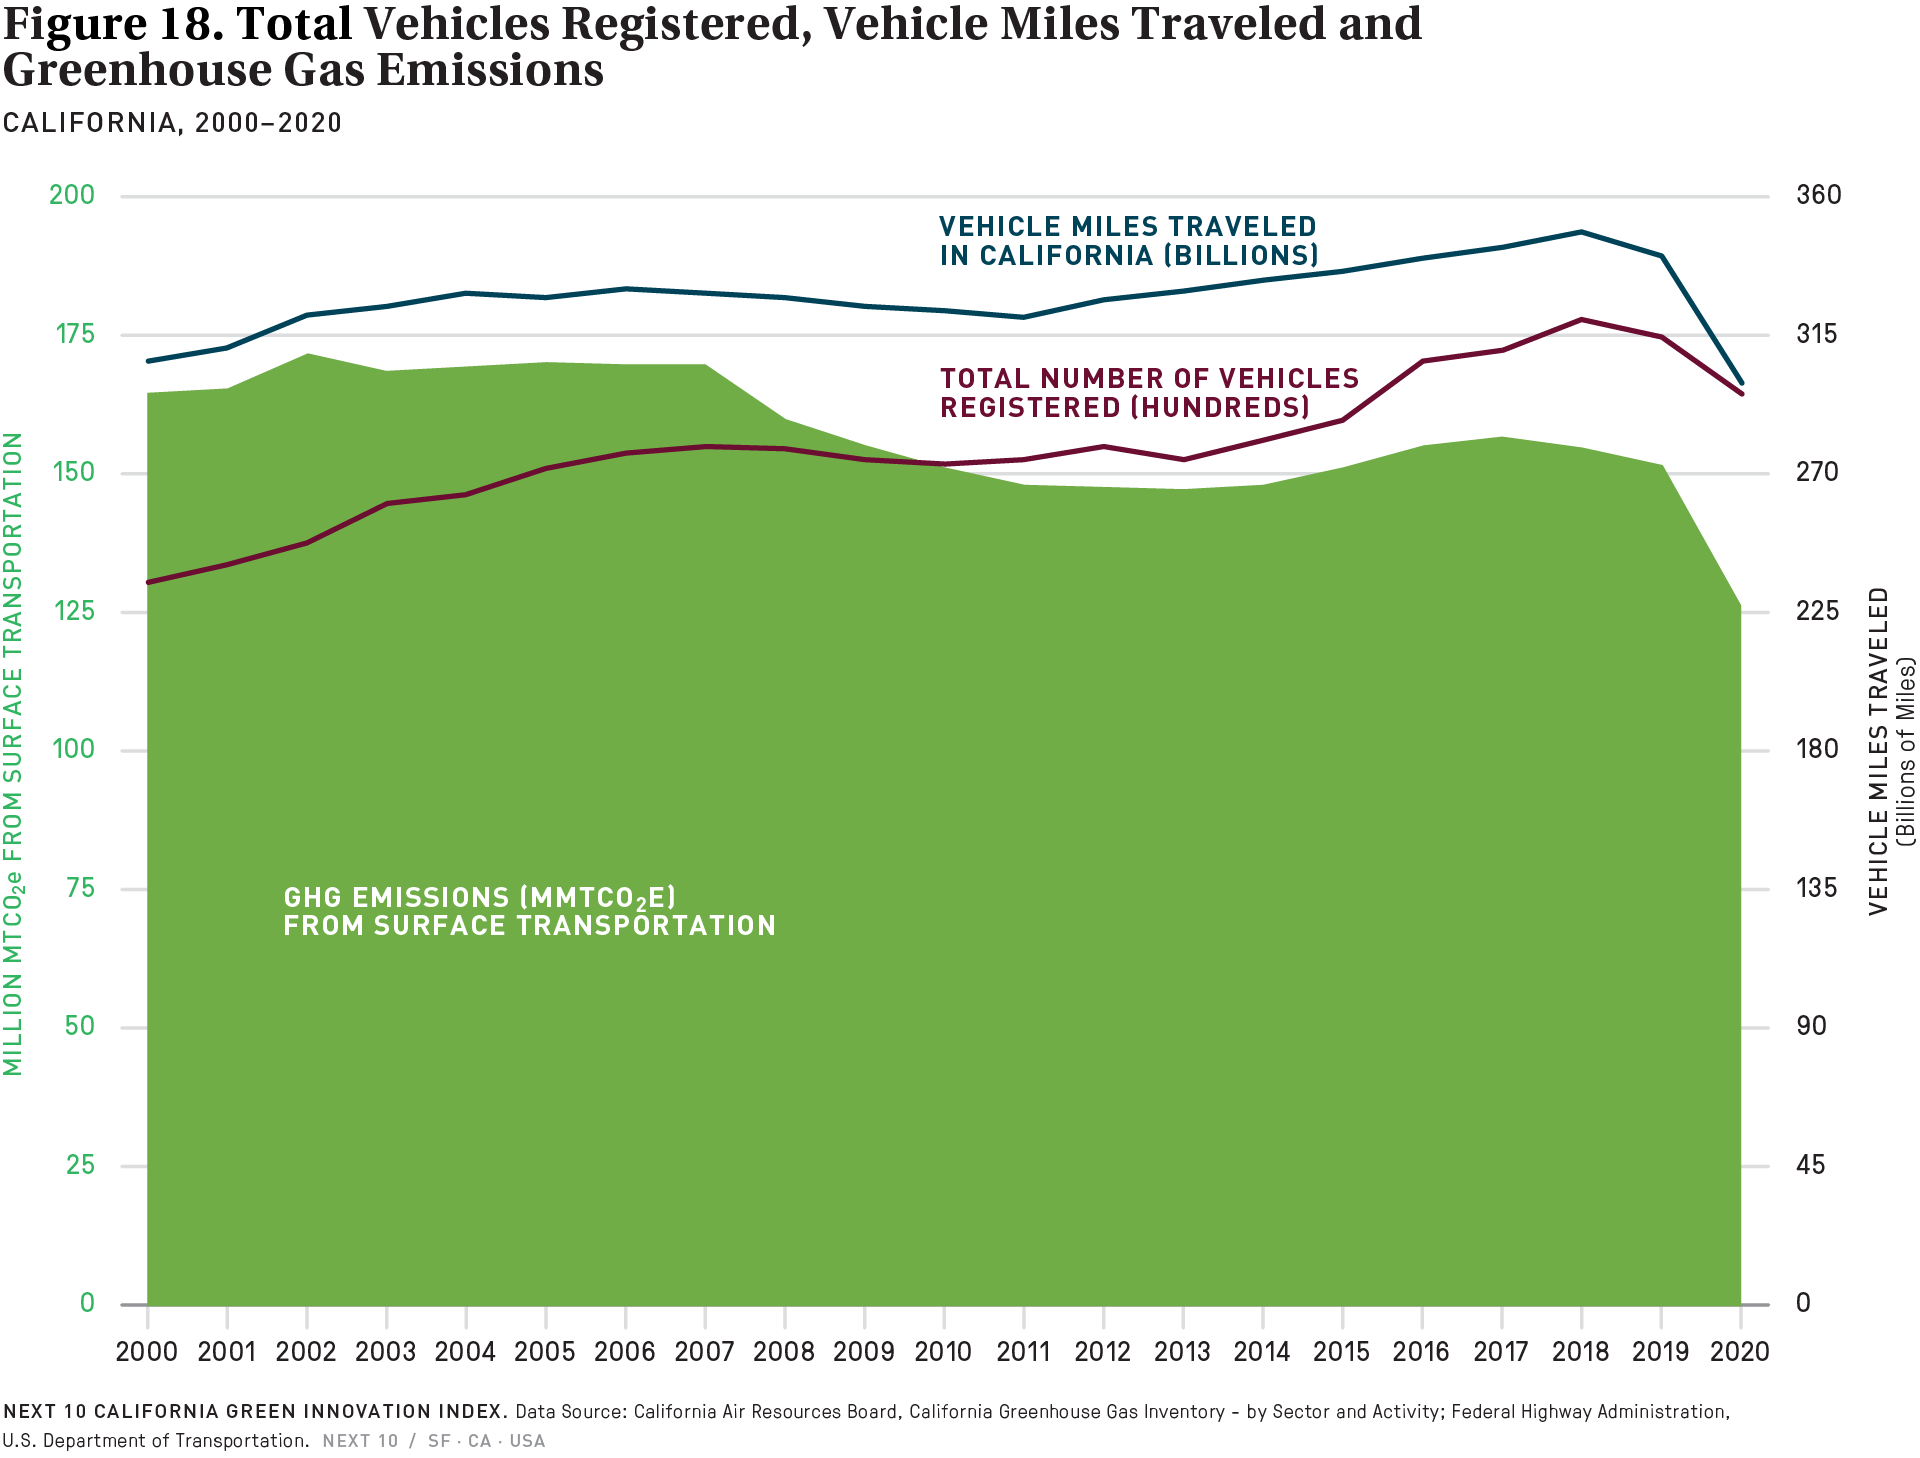
- Due to the restrictions on travel in response to the COVID-19 pandemic, after years of increases in the total number of vehicles registered and vehicle miles traveled (VMT), both figures dropped 2019 to 2020 (the latest year for which data are available). Between 2019 and 2020, vehicle miles traveled (VMT) in California dropped 12.0 percent (or 41,024 miles) to 299.8 billion miles, and the number of vehicles registered fell by 5.9 percent. GHG emissions from surface transportation had a higher decline (-16.5%) from 2019 to 2020; and were 16.3 percent lower than the 2010 emissions level. While GHG emissions from transportation in 2021 are not yet known, the number of vehicles registered saw a significant increase of 3.9 percent in 2021 compared to 2020.89
89 Vehicle registration data from the California Energy Commission, California Department of Motor Vehicles – Quarterly vehicle registration database.
Challenge
- Customer demand in the California vehicle market continued to shift towards pickup trucks, mini-vans, and SUVS. The share of subcompact SUVs saw the highest sales growth—increasing by 41 percent in 2021, followed by compact pickups (+32.2%). Newly registered SUVs as a share of total vehicle registrations has been on a steady incline—accounting for 43.5 percent of all body types from 2019 to 2020, and surpassing 50 percent for the first time from 2020 to 2021. Previously in 2020, total new vehicle registrations were down 15.6 percent compared to 2019. In particular, pickup sales (-24.5%) fell more than car sales (-18.2%). However, the continuous consumer shift from smaller (more fuel-efficient) vehicles to midsize (less fuel-efficient) vehicles could reduce the overall fuel economy of the statewide fleet. The general demand for new vehicles may ease in 2022 due to economic uncertainty and rising interest rates, while the EV market is expected to remain robust into 2023.
More About
Transportation
Related Content