Data Source: California Independent System Operator. Analysis by Beacon Economics
Highlight
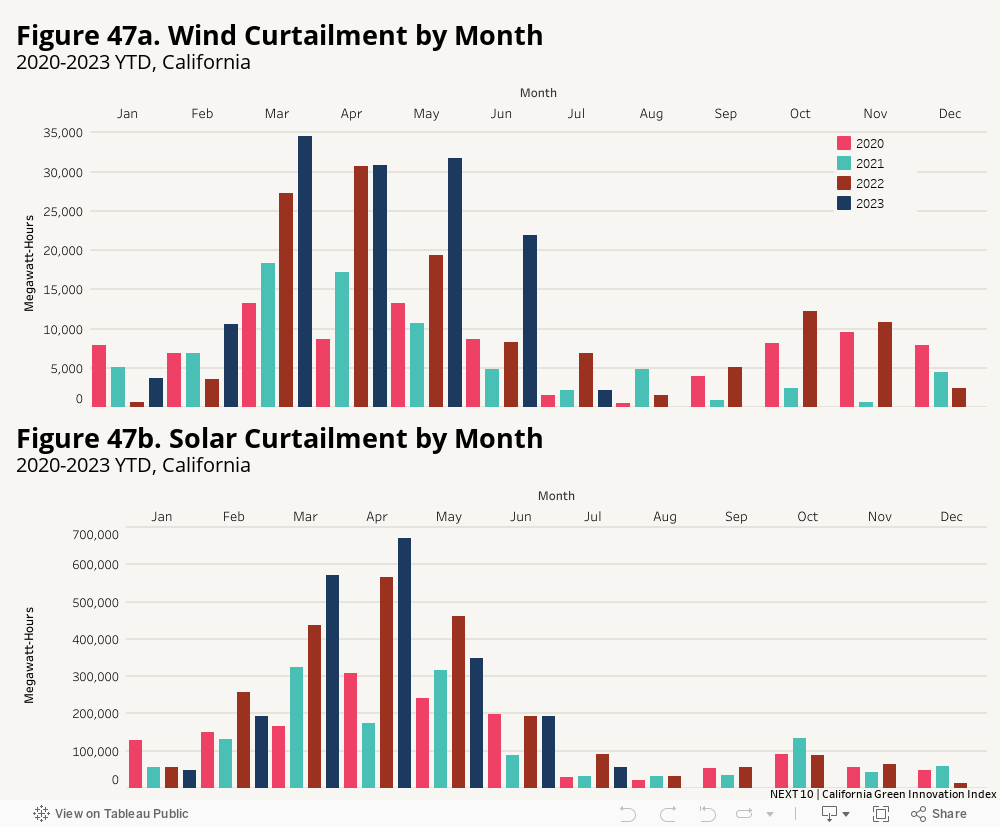
- Although curtailment141 has been increasing, it makes up a small percentage of total in-state generation. In 2022 in-state generation from solar was 40,494 GWh; the curtailment represents 5.1 percent of in-state generation. Wind curtailment was less than one percent in 2022. Also, electricity generated from renewable sources tend to be higher when curtailment is also high.
141 Curtailment is the reduction of output of a renewable resource below what it could have otherwise produced. At times power generators may produce output that is not needed. In the absence of energy storage systems, the surplus may have to be dumped or the power plant output turned down or switched off for a while.
Challenge
- In California, curtailments have been rising every year, driven by growth in solar power to meet the state’s aggressive clean energy goals. As more renewables come online, without robust additional transmission and storage buildout, California faces an increasing amount of wind and solar generation curtailment, especially during the middle of the day (from 10 AM to 2 PM), when there is an oversupply of solar. In July 2023, curtailment totaled 2,218 gigawatt-hour electricity generated (135.5 GWh from wind and 2,082 GWh from solar), according to California Independent System Operator (CAISO). Curtailment and the negative prices that come with it are a powerful signal that there is money to be made by energy storage tech. This 7-month curtailment in 2023 represents a 115.7 percent increase over the total curtailments in 2019 (965.2 GWh), which itself is more than 3.5 times of the total curtailment amount in 2018 (461.0 GWh). Year-over-year, the 7-month curtailment in 2023 is slightly higher than the first 7 month recorded in 2022, representing a 2.6 percent increase (40% increase in wind, 0.9% increase in solar). Curtailment tends to be at the highest levels from March to June and lowest from July to December.
More About
Renewable Energy
Related Content