Energy Efficiency

California has long been recognized as a leader in energy efficiency—from adopting the first-in-the-nation appliance efficiency standards (Title 20) in the 1970s to the first standards on battery chargers in 2012. As California looks to decarbonize by 2045 and transition toward greater utilization of clean electricity sources, there has been accelerating momentum to electrify buildings, homes, and transportation.

At the federal level, the Biden Administration allocated over $900 million to the California Energy Commission (CEC) home energy efficiency and equitable building decarbonization program.162 This funding was provided under the Inflation Reduction Act (IRA)163 and was specifically targeted towards programs benefiting low- and middle-income households.

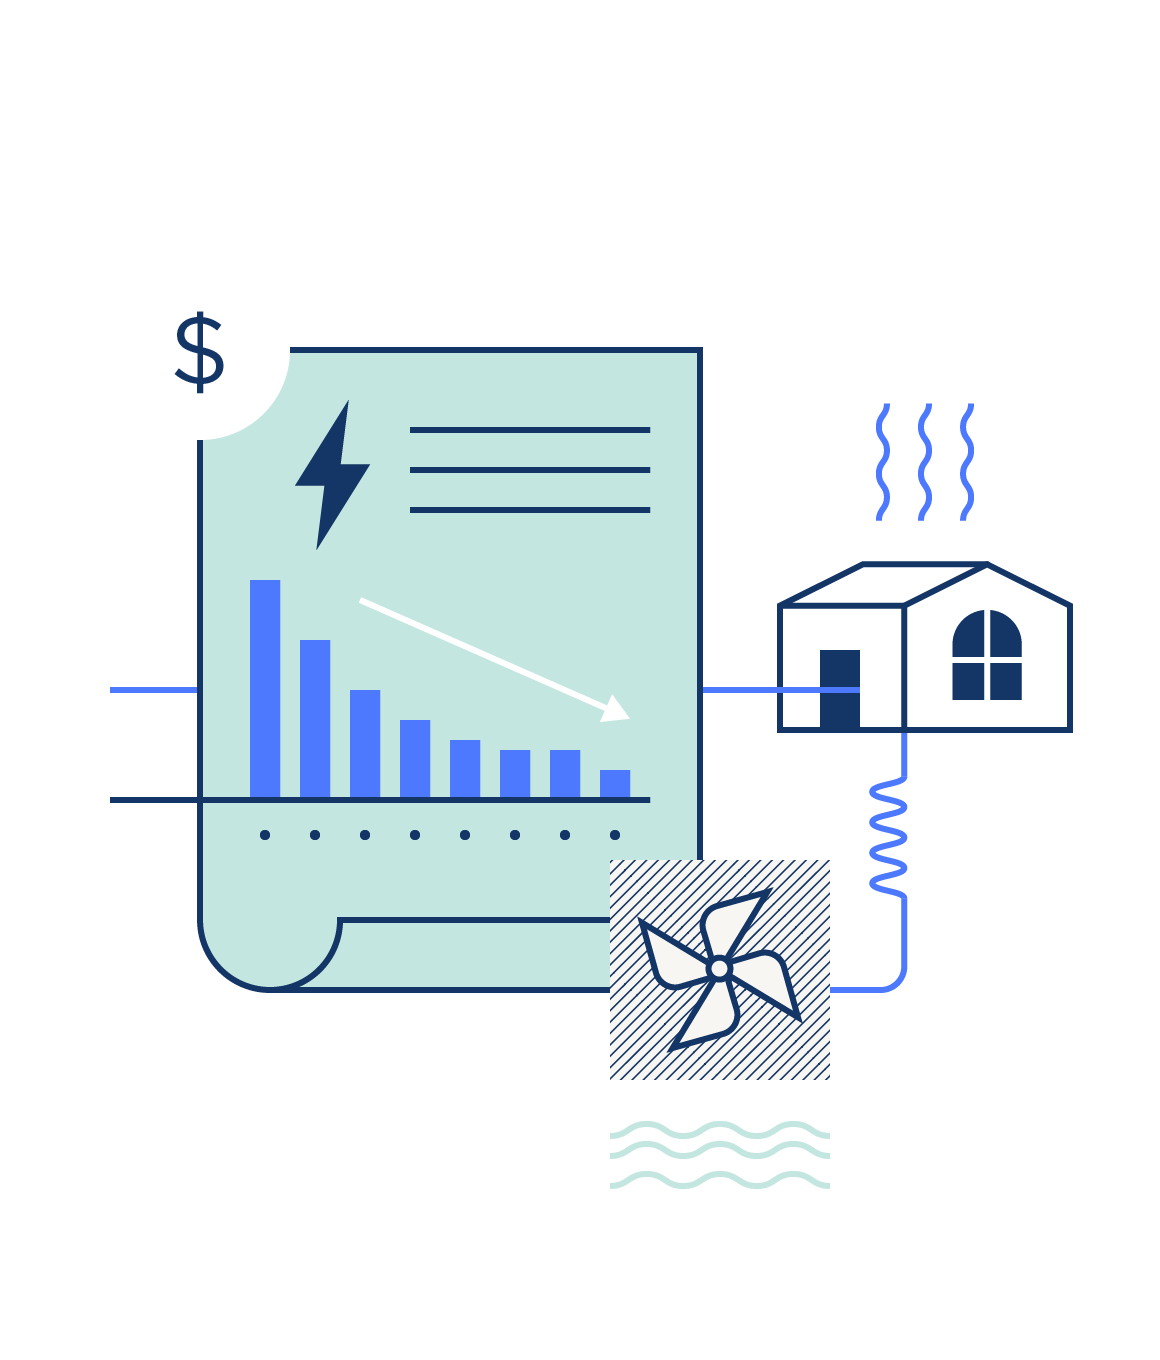
In 2022, California emerged as a leader in the push towards zero-emissions appliances by committing to a statewide standard.164 More than 70 local jurisdictions have adopted electric-friendly codes to the current state building code, leading the way for other cities like New York to adopt similar climate policies.165 In addition, Governor Newsom proposed a statewide zero-emissions appliance standard that aims to increase the sales of heat pumps166 and set targets of 6 million heat pumps in buildings and 3 million climate-ready and climate friendly homes by 2030.167 Moreover, the California Public Utilities Commission (CPUC) took a groundbreaking step by eliminating subsidies for new gas system connections that took effect in July 2023, making California the first in the nation to take such action.168

The rebounding economy played a significant role in driving up energy consumption in California in 2021—both in total and per capita terms—with notable increases of 3.6 percent and 3.4 percent, respectively. However, California’s total statewide energy consumption was 3.8 percent lower in 2021 than in 1990, while energy consumption per capita declined even faster—decreasing by 25.9 percent. Among the end-use sectors, the transportation sector experienced the most substantial surge, witnessing an 18.2 percent increase in California compared to 2020. This surge can primarily be attributed to the higher demand for fossil fuels, encompassing both electricity and non-electricity sources.

While California achieved significant milestones in 2022, it is important to maintain momentum. The state has set ambitious targets under SB 350, aiming to double its energy productivity level.169 To achieve this, California must strive to maintain an average annual growth rate of 3.5 percent in energy productivity. This underscores the need for continued efforts and investments in energy efficiency and sustainable practices to ensure a sustainable and resilient energy future for the state.

Energy Productivity
  • In 2021, California generated $4.68 of GDP (inflation-adjusted) for every 10,000 British Thermal Units (BTU) of energy consumed, double the national average of $2.21/10,000 BTU of energy consumed.

  • California has continuously outperformed the rest of the U.S. in terms of energy efficiency gains as share of GDP produced—averaging a 4.0 percent compounded average growth rate (CAGR) between 2011 and 2021, doubled the 1.8 percent CAGR recorded for the rest of the U.S. during the same period.

Energy Intensity
  • Energy intensity (defined as energy consumption relative to GDP) decreased by 1.5 percent from 2020 to 2021. The residential sector led the way with a 9.4 percent reduction, followed by a 7.5 percent decrease in the industrial sector.

  • The energy intensity of the residential sector saw a year-over-year increase of 6.5 percent from 2019 to 2020—the first time an increase has occurred since the Great Recession. From 2020 to 2021, the sector witnessed a rapid decline of 9.4 percent, the fastest rate since 2000 (decrease by 10.0%).

Energy Consumption
  • California’s total statewide energy consumption was 3.8 percent lower in 2021 than in 1990, while energy consumption per capita declined even faster—decreasing by 25.9 percent.

  • Energy consumption has decreased faster in California than the rest of the U.S. in recent years, as California’s population has been growing at a slower pace. From 2016 to 2021, total energy consumption decreased by 6.0 percent in California, while consumption decreased by 0.8 percent in the rest of the U.S.

  • Renewable energy170 is the fastest-growing fuel source for both electric and non-electric consumption, growing by 5.6 and 128.7 percent, respectively, between 2011 to 2021.

  • Non-electricity natural gas consumption in several end-sectors have remained consistently higher than those recorded in 2001. Among these sectors, the commercial and the ‘other’ sectors stand out as the largest consumers, surpassing the 2001 consumption levels by 6.4 percent and 4.2 percent, respectively. Luckily, non-electricity natural gas consumption was 13.6 percent lower in 2021 than 2013.

  • There has been a notable decline in the consumption of non-electricity natural gas, which has decreased by 3.4 percent from 2016 to 2021. This decline has been largely offset by the increased adoption of renewable energy sources in the state.

  • In 2021, natural gas consumption had declined by 5.1 percent while electricity consumption in California has increased by 35.3 percent, when compared to 2001.

  • While energy consumption in the industrial sector has been declining in recent years, the opposite is true for the residential and the transportation sectors—which rose by 0.7 percent and 19.3 percent, respectively, from 2020 to 2021.

  • In particular, in the transportation sector where energy consumption increased by 19.3 percent from 2020 to 2021, it was the largest increase in any sector as energy consumption and vehicle miles traveled in 2020 were lower than average.

Electricity and Energy Consumption Comparisons
  • In 2021, California (6.32 megawatt-hours/person) had the second-lowest per capita electricity consumption among the fifty states, behind Hawaii (6.17 MWh/person). In 2021, California (184.00 million BTU) had the third-lowest per capita energy consumption, which includes electricity consumption, among the fifty states behind Rhode Island (169.43 million BTU) and New York (178.05 million BTU).

  • Per-capita electricity consumption in California fell by 9.2 percent from 2011 to 2021. The state is decreasing significantly faster than its peers, nearly double the 4.6 percent decrease recorded for the rest of the U.S. over the same period. While energy consumption per capita in California declined even faster—decreasing by 9.5 percent from 2011 to 2021—the rest of the U.S. decreased by 5 percent during the same period.

  • From 2016 to 2021, California’s per capita electricity consumption decreased 3.7 percent, while its per capita energy consumption decreased even faster—by 5.8 percent over the same time period.

  • As California looks to replace fossil fuel-powered vehicles with zero-emission vehicles (ZEVs), the demand for electricity is likely to increase in the transportation sector. From 2016 to 2021, California’s per capita electricity consumption increased by 3.7 percent. This seems to suggest that the electrification efforts in transportation have been effective in driving up electricity consumption in recent years.

  • California natural gas and electricity consumption combined has held relatively steady (-1.0%) between 2000 and 2021. Within the total combined consumption, natural gas consumption is decreasing faster than the increase in electricity consumption—natural gas consumption was 7.7 percent lower in 2021 than in 2000, while electricity consumption increased by 6.7 percent during the same period.

  • Natural gas non-electricity consumption in California was still 24.4 percent higher than electricity consumption in 2021. Additionally, several sectors including transportation (+13.7%), residential (+9.0%) and commercial (+1.2%) all have had sustained increases in natural gas consumption since 2016. Notably, the increase of natural gas consumption in the transportation sector has leveled off since 2014, increasing by an annual average of only 2.7 percent each year. The 2021 level was also 3.4 percent lower than 2019 level.

Electricity and Energy Bills Comparisons
  • California’s electricity bill as a percentage of GDP was 1.45 percent in 2021, down from 1.51 percent in 2020. Meanwhile, California’s energy expenditures amount to 4.5 percent of GDP in 2021, up 17 percent from 2020, but still 2.7 percent short of the pre-pandemic level in 2019.

  • Although California has some of the highest electricity costs per kilowatt-hour (kWh) in the U.S., it had the fourth-lowest electricity bill as percentage of GDP (1.45%) in 2021— behind New York (1.23%), Washington (1.16%) and Utah (1.24%)—driven by low electricity consumption. In effect, California's lower electricity consumption, despite its higher electricity costs, has resulted in a lower electricity bill as a percentage of its overall economic activity.

  • California's average monthly commercial electricity bill has become considerably more expensive relative to the U.S. average during the last decade, from 31.3 percent higher in 2011 to 52.7 percent higher in 2021. Moreover, California's once-held advantage of having a lower average residential electricity bill compared to the rest of the United States has vanished in the wake of the pandemic. In 2011, the margin stood at 15.9 percent below the national average, but as of 2021, it has shifted to a 2.2 percent higher than the U.S. average.

Energy Transition in Residential Buildings
  • As of October 18, 2023, 68 cities and counties had adopted local ordinances exceeding the current (2022) energy code.

  • Only one jurisdiction (Los Gatos) has adopted an ordinance requiring buildings to prewire for battery storage, and battery storage will play an increasingly important role in grid resiliency and accelerating renewable energy.

  • Out of the 418 jurisdictions in California, approximately 60 percent of them rely primarily on utility gas for heating.

  • In owner-occupied housing units, home heating fuel types that increased in market share are both electricity (+8.6%) and utility gas (+1.4%) 2021.

  • In the home heating fuel by source, renter-occupied housing saw an increase in market share of electricity (+2.9%) and a decrease of utility gas (-2.0%) in 2021.

  • As of 2021, California held the distinction of having the second-highest solar market share (0.83%) among states, falling behind only Hawaii (4.01%). Although the number of households in Arizona represent only 20 percent of the California number, the solar units per capita rate in Arizona is comparable to that in California, despite California's much larger population.

  • In contrast to previous years, California's rooftop solar adoption rate was stagnant in 2020 due to the pandemic. However, in 2021, the state saw a 15.5 percent yearly increase in solar adoption among households, which is slightly slower than the U.S. average. This marks the second consecutive year that California's growth rate has been slower than that of the U.S.

  • While renter-occupied housing units171 powered by solar energy, as a share of the total, grew by 10.1 percent in 2020 (from 2019) and decreased by 1.9 percent in 2021 (from 2020), owner-occupied housing’s share grew by 8.9 percent in 2020 and by 0.9 percent in 2021.

Footnotes

162 California Energy Commission. Equitable Building Decarbonization Program. Available at: https://www.energy.ca.gov/programs-and-topics/programs/equitable-building-decarbonization-program

163 IRS. Home Energy Tax Credits. May 08, 2023. Accessed June 22, 2023. Retrieved from: https://www.irs.gov/credits-deductions/home-energy-tax-credits

164 California Air Resources Board. 2022 Scoping Plan Update, Zero-Emission Appliance Standards. December 2022. Accessed June 22, 2023. Retrieved from: https://ww2.arb.ca.gov/our-work/programs/zero-emission-appliance-standards/about

165 2020 NYC Energy Conservation Code. May 12, 2020. Accessed June 22, 2023. Retrieved from: https://www.nyc.gov/site/buildings/codes/energy-conservation-code.page

166 Heat pumps are an efficient and environmentally friendly alternative to traditional heating and cooling systems.

167 Office of Governor. Governors-Letter-to-CARB. July 22, 2022. Accessed June 22, 2023. Retrieved from: https://www.gov.ca.gov/wp-content/uploads/2022/07/07.22.2022-Governors-Letter-to-CARB.pdf?emrc=1054d6

168 The California Public Utilities Commission. Agenda Decision. September 22, 2022. Accessed June 22, 2023. Retrieved from: https://docs.cpuc.ca.gov/SearchRes.aspx?docformat=ALL&docid=496876177

169 “Clean Energy and Pollution Reduction Act – SB 350.” California Energy Commission. Available at: https://www.energy.ca.gov/rules-and-regulations/energy-suppliers-reporting/clean-energy-and-pollution-reduction-act-sb-350

170 This includes biodiesel and fuel ethanol as well as non-RPS eligible sources such as conventional hydroelectric. The State Energy Data Systems (SEDS) does not distinguish conventional hydroelectric from small hydro.

171 A total of 145,452 households are embracing solar energy to power their homes, with 12,964 being homeowners and 15,848 being renters.