
Source: California Air Resources Board, California Greenhouse Gas Inventory - by Sector and Activity; California Department of Transportation; California Department of Finance.
Analysis by Beacon Economics
Highlights
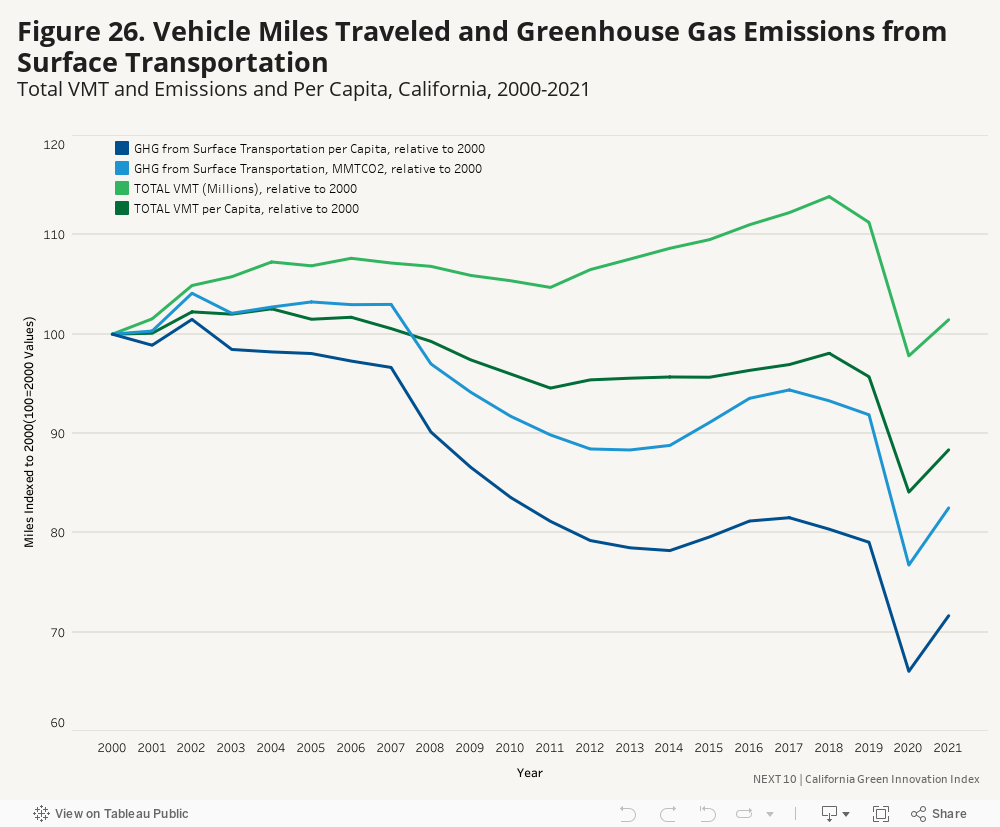
- Total vehicle miles traveled (VMT) in California increased by 3.7 percent (or 11,011 miles) between 2020 and 2021, to 310.8 billion miles. Meanwhile, VMT per capita also increased by 5 percent during the same period to 7,964 miles per person. While the total population has declined by 0.9 percent in California, and while total vehicle ownership rates have declined in line with the population, the total VMT (millions) increased slightly faster than the population in 2021. The total VMT (millions) saw a significant drop in 2020 due to COVID-19 restrictions and as more individuals opted for remote work in 2020 compared to 2021.
- GHG emissions from surface transportation in California increased by 7.5 percent or 9.5 MMTCO2e from 2020 to 2021, while the GHG emission from surface transportation per capita increased by 8.5 percent during the same period. When compared to 2019 levels, both per capita vehicle miles traveled (-7.7%) and total vehicle miles traveled (-8.8%) were lower in 2021. Total GHG emissions from surface transportation (-10.2%) and emissions per capita (-9.4%) were also lower in 2021 compared to the 2019 pre-pandemic level.
More About
Transportation
Related Content