
Highlights
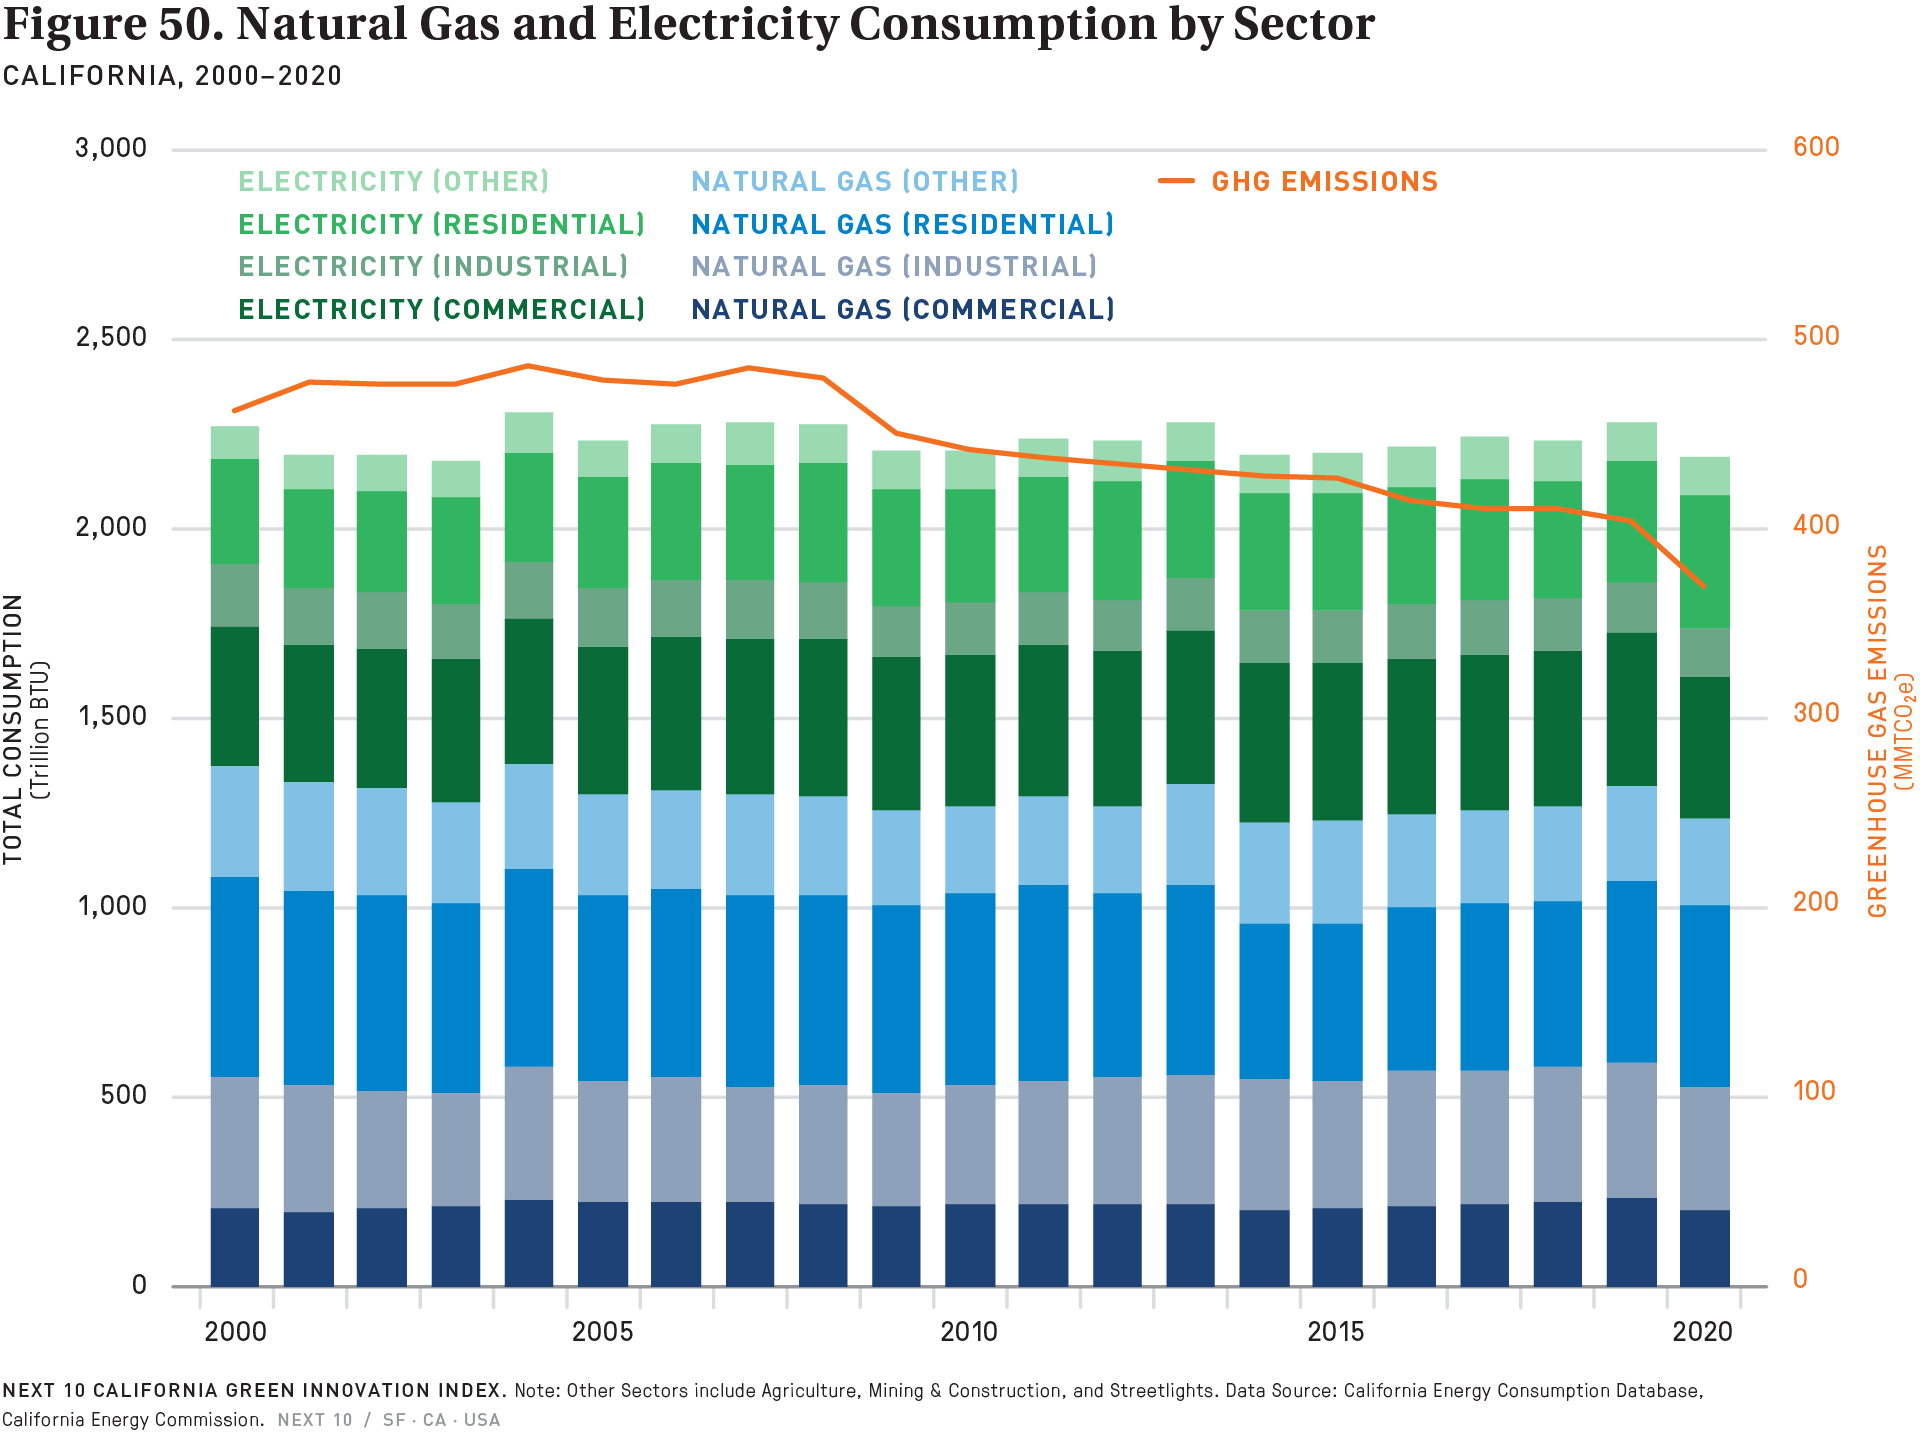
- California natural gas consumption was 6 percent lower in 2020 than in 2019, while electricity consumption also decreased by an average of 2 percent during the same period—except for the residential sector where it increased by 11 percent from 2019 to 2020, in a shift that likely reflects increased demand for residential energy as more people started working from home once the COVID-19 pandemic struck in early 2020. Additionally, unusually high statewide Cooling Degree Days likely contributed to the increase.181 Per capita natural gas consumption and electricity consumption in the residential sector were 21.6 percent lower and 10.6 percent lower, respectively, from 2000 to 2020—suggesting both a gradual gain in energy efficiency in residential buildings and that electricity has become more popular relative to natural gas in powering residential buildings.
- Per capita natural gas consumption across all sectors was 22.6 percent lower in 2020 than in 2000, and 6.5 percent lower than in 2019. Per capita electricity consumption (all sectors) was 8.5 percent lower in 2020 than in 2000, and 6.2 percent lower than in 2009.
181 The California Environmental Protection Agency’s Office of Environmental Health Hazard Assessment (OEHHA). Cooling and heating degree days. Indicators of Climate Change in California (2022). Available at https://oehha.ca.gov/media/02degreedays.pdf
More About
Energy Efficiency
Related Content