
Note: Gross greenhouse gas emissions (GHG) includes fossil fuel CO2, with electric imports and international fuels (carbon dioxide equivalents) and noncarbon GHG emissions (in CO2 equivalents). Non-carbon GHG emissions are made up of Agriculture (CH4 and N2O), Soils, ODS substitutes, Semi-conductor manufacture (PFCs), Electric Utilities (SF6). Cement, Other Industrial Processes, Solid Waste Management, Landfill Gas, and Wastewater, Methane from oil and gas systems, Methane and N2O from Fossil Fuel Combustion.
Data Source: California Air Resources Board, California Greenhouse Gas Inventory - by Sector and Activity
Analysis by Beacon Economics
Highlights
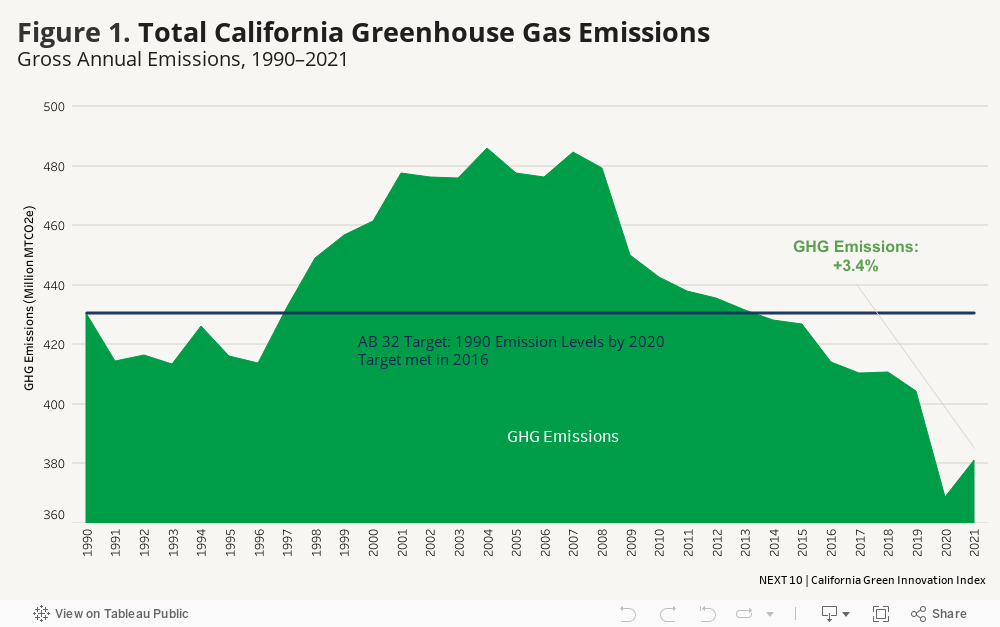
- After meeting the 2020 goal four years early in 2016, total greenhouse gas emissions6 were 381.30 MMTCO2e in 2021, which is 11.5 percent (-49.7 MMTCO2e) below the 1990 level of 431 MMTCO2e. Total GHG emissions increased by 3.4 percent (+12.6 MMTCO2e) from 2020 to 2021. The rise in emissions occurred after the significant drop of 8.8 percent (-35.7 MMTCO2e) in 2020 due to the pandemic—which was the largest decline since 2000 (the second-largest decrease was 6.1% during the Great Recession from 2008 to 2009).
- While many of the sectors experienced a rebound from 2020 to 2021, others did not. GHG emissions from the residential sector decreased by 2.3 percent (-0.6 MMTCO2e) and the emissions from the heavy-duty vehicles sub-sector decreased slightly by 1.6 percent (-0.5 MMTCO2e). Emissions from the agriculture and recycling & waste sectors decreased by 2.1 percent (-0.7 MMTCO2e) and by 1.7 percent (-0.1 MMTCO2e), respectively. The high global warming potential (GWP) sector7 remained unchanged from 2020.
- The primary driver of the overall increase in GHG emissions from 2020 to 2021 was the transportation sector, which saw a rise of 7.4 percent (+10.0 MMTCO2e). However, thanks to the 26.6 MMTCO2e decrease in 2020, transportation emissions remained 10.2 percent (-16.6 MMTCO2e) lower in 2021 than in 2019. The electric power sector also experienced a one-year increase of 4.8 percent (+2.8 MMTCO2e) in 2021. However, electric power emissions rebounded by more than the previous small decrease of 0.7 MMTCO2e in 2020, leading the sector to be 3.5 percent (+2.1 MMTCO2e) higher in 2021 than 2019. The industrial and commercial sectors increased by 0.9 percent (+0.6 MMTCO2e) and by 3.7 percent (+0.5 MMTCO2e), respectively from 2020 to 2021. Both the industrial and commercial sectors maintained lower emissions in 2021 than in 2019.
- Within the electric power sector, the in-state generation sub-sector was 10.3 percent (+4.0 MMTCO2e) higher in 2021 than 2019 level, due to a continuous increase since 2020 when it increased by 6.2 percent (+2.4 MMTCO2e). Meanwhile, the imports sub-sector was 8.5 percent (-1.8 MMTCO2e) lower in 2021 than 2019 levels, despite a small one year rebound of 6.7 percent (+1.3 MMTCO2e) from 2020 to 2021. In 2020, the emissions from imports decreased by 14.3 percent (-3.1 MMTCO2e) from 2019.
- Compared to 2019, total California emissions remained 5.7 percent (-23.1 MMTCO2e) lower in 2021. The transportation sector had the largest decrease of 10.2 percent (-16.6 MMTCO2e) from 2019, followed by the industrial, commercial, residential, and agriculture sectors. In fact, every transportation sub-sector (including passenger vehicles, heavy duty vehicles, aviation & rail & ships and off-road & unspecified sectors) had lower emissions in 2021 than in 2019. Over the same time period, emissions from the industrial sector fell by 8.6 percent (-6.9 MMTCO2e) and the residential sector also saw a 4.4 percent (-1.1 MMTCO2e) reduction. GHG emissions in the commercial sector experienced a 4.5 percent decrease (-0.7 MMTCO2e), while the agriculture sector also declined by 1.5 percent (-0.5 MMTCO2e). The recycling and waste sector GHG emission remained unchanged from 2019.
6 The GHG inventory was developed in accordance with the Intergovernmental Panel on Climate Change (IPCC) Guidelines for National GHG Inventories, the internationally recognized standard for developing national GHG inventories. There exist other categories besides included emissions: excluded emissions, carbon dioxide from biogenic materials, emissions and removals from forest lands and wood products, and other emissions. Excluded emissions are discussed elsewhere in this chapter.
7 High-global warming potential (high-GWP) refrigerants include all ozone-depleting substances and any refrigerant with a GWP of 150 or higher. More information available here: https://ww2.arb.ca.gov/resources/documents/high-gwp-refrigerants