
Data Source: California Air Resources Board, California Greenhouse Gas Inventory - by Sector and Activity
Analysis by Beacon Economics
Highlights
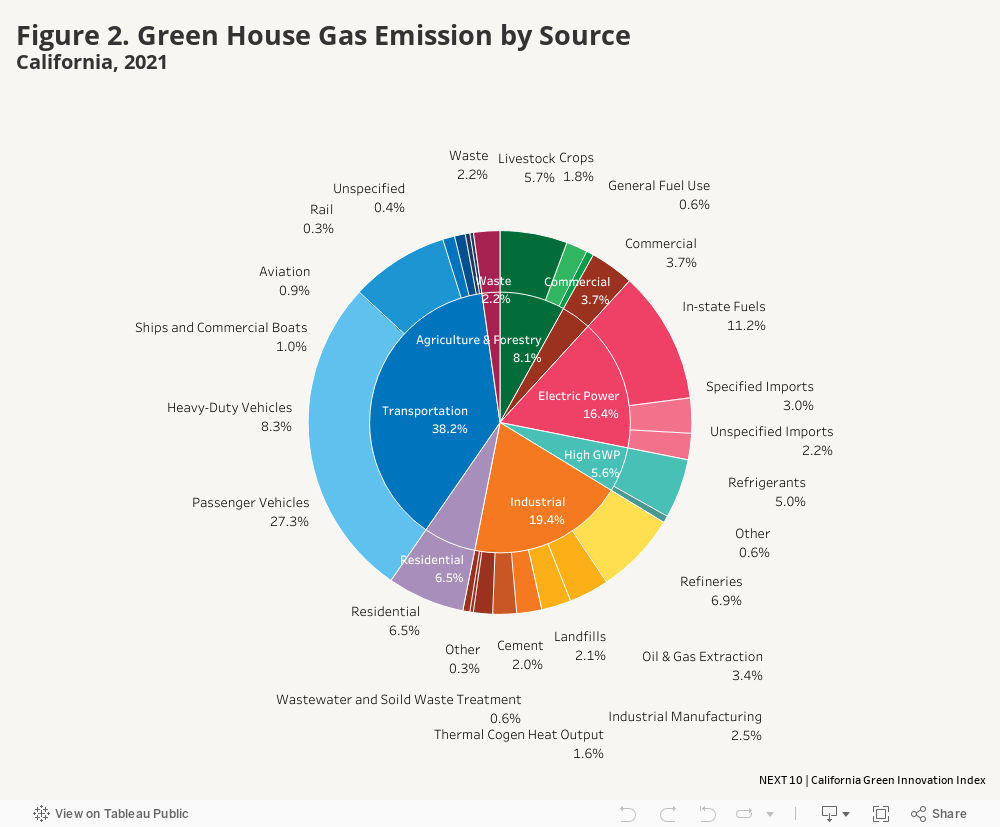
- The transportation sector remains the largest-emitting sector in California. In 2021, its share of total emissions further increased to 38.2 percent compared to 36.8 percent in 2020. This increase was mostly due to the share of total emissions from the passenger vehicle sub-sector emissions increased from 24.7 percent in 2020 to 27.3 percent in 2021, as impacted by the relaxation of restrictions and travel constraints during the pandemic. Another important on-road emission sector—the heavy-duty vehicles subsector—has been the main contributor to the drop in GHG emissions from on-road vehicles since 2018. Even as pandemic restrictions were lifted, the heavy-duty vehicles subsector GHG emission did not rebound to the pre-pandemic level. In fact, it continued to decline in 2021. Compared to 2020, emissions from heavy-duty vehicles decreased by 1.6 percent (-0.5 MMTCO2e) in 2021. When compared to the pre-pandemic level, the heavy-duty vehicle subsector emissions had decreased by 9.5 percent (-3.3 MMTCO2e) in 2021. Compared to 2018, the sub-sectors emissions have decreased by 14.1 percent (-5.2 MMTCO2e). Specifically, the share of total emissions from heavy-duty vehicles decreased from 9 percent in 2018 to 8.3 percent in 2021.
- The transportation sector emissions were 10.2 percent (-16.6 MMTCO2e) lower in 2021 than in 2019. The transportation sector’s share of total emissions further increased to 38.2 percent in 2021 but remained lower than the 2019 share of 40.1 percent. This is achieved not only by a continuously decreasing heavy-duty vehicle subsector since 2018, but also thanks to the significant decline in emissions from the passenger vehicles sub-sector in 2020, which decreased by 19.0 percent (-22.1 MMTCO2e) in 2020. The share of total emissions from passenger vehicles comprised 27.3 percent of the total emissions in 2021, down 1.4 percent from the 2019 share of 28.7 percent. Although there was a rebound of 10.6 percent (+10.0 MMTCO2e) in 2021 compared to 2020, the passenger vehicles sub-sector emissions were still 10.4 percent (-12.1 MMTCO2e) lower than the 2019 levels.
- In the five years from 2016 to 2021, the residential sectors’ share of total GHG emissions rose from 5.9 percent to 6.5 percent, while the commercial sector also increased from 3.5 percent to 3.7 percent. The main driver of GHG emission increases in these sectors is the increasing use of substitutes for ozone-depleting substances (substitutes for ODS) for refrigeration and air conditioning activities. In 2021, commercial refrigerants accounted for 43.9 percent of the emissions from substitutes for ODS, while residential refrigerants made up 20.2 percent. In the commercial sector, ozone-depleting substances (ODS) emissions stand 1.8 percent above the 2019 levels. Notably, ODS emissions surged significantly during the pandemic in 2020, increasing by 2.5 percent from 2019 levels. Although there was a decrease of 1.8 percent in 2021 compared to 2020, it hasn't fully offset the rise observed during the Pandemic (2020). In terms of the residential sector, the ozone-depleting substances emissions is 15.6 percent above the 2019 levels, specifically, the ODS emissions has been rising every year since 2019, increased by 8.6 percent in 2020 and increased again by 6.5 percent in 2021.
Challenges
- The surge in electric power emissions since 2019 primarily stems from a notable increase of 10.3 percent (+4.0 MMTCO2e) in the in-state generation sub-sector. Comparing to pre-pandemic (2019) levels, emissions from the electric power sector are 3.5 percent (+2.1 MMTCO2e) higher in 2021. Furthermore, following the pandemic-induced decline (-1.2% in 2020), emissions from the electric power sector rebounded by 4.8 percent (+2.8 MMTCO2e). Remarkably, the in-state generation sub-sector has shown consistent growth each year since 2019. Specifically, the in-state generation sub-sector's emissions increased year-over-year by 3.9 percent (+1.6 MMTCO2e) in 2021 from 2020, following a previous year-over-year increase of 6.2 percent (+2.4 MMTCO2e) seen during the pandemic (2020), contributing to the overall emissions rise observed in the total electric power sector. Despite emissions bouncing back by 6.7 percent (+1.3 MMTCO2e) in 2021 from the previous year, the import sub-sector witnessed an 8.5 percent decrease (-1.8 MMTCO2e) compared to 2019 levels, mainly due to the large decrease seen in 2020, where it decreased by 14.3 percent.
- GHG emissions from the commercial sector slightly rebounded in 2021 from the previous decline in 2020, while the residential sector continued to decline in 2021 following the previous decline in 2020. Specifically, emissions from the residential sector decreased by 2.3 percent (-0.6 MMTCO2e) from the 2.1 percent decrease (-0.6 MMTCO2e) in 2020. Emissions from the residential sector were also 4.4 percent (-1.1 MMTCO2e) less than in 2019. Conversely, commercial sector emissions rebounded by 3.7 percent (+0.5 MMTCO2e) in 2021 compared to 2020. The 2021 emissions were still lower than the 2019 emissions level by 4.5 percent (-0.7 MMTCO2e). As a share of total emissions in 2021, the residential sector accounted for 6.5 percent (from 6.9% in 2020), while commercial sector emissions increased slightly to 3.68 percent (from 3.67% in 2020).
More About
Carbon Economy
Related Content