
*GHG emissions data that allows for state-level comparison is from the Energy Information Administration and is limited to carbon emissions (fossil fuel combustion). Therefore, data represented here differs from analyses represented in other charts of total GHG emissions for California.
Data Source: Energy Information Administration, U.S. Department of Energy; Bureau of Economic Analysis, U.S. Department of Commerce.
Analysis by Beacon Economics
Highlight
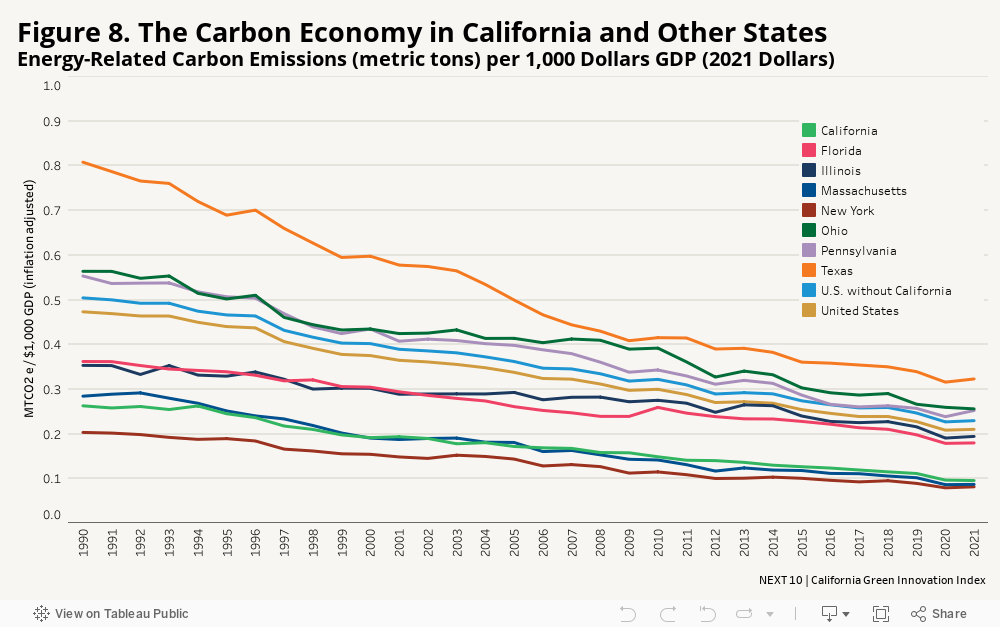
- Among the fifty states (excluding the District of Columbia), California maintained its position as the third-most carbon-efficient state (defined as MTCO2e relative to inflation-adjusted GDP) in 2021. The state reached 0.096 emissions (metric tons) per 1,000 dollars of GDP (inflation adjusted to 2021 dollars), behind only New York (0.082 MTCO2e/$1,000) and Massachusetts (0.087 MTCO2e /$1,000).
More About
Carbon Economy
Related Content