
Note: GDP in real 2021 U.S. dollars. Greenhouse gas emissions are from consumption of energy.
Data Source: U.S. Energy Information Administration; U.S. Bureau of Economic Research Service; U.S. Census Bureau.
Analysis by Beacon Economics
Highlights
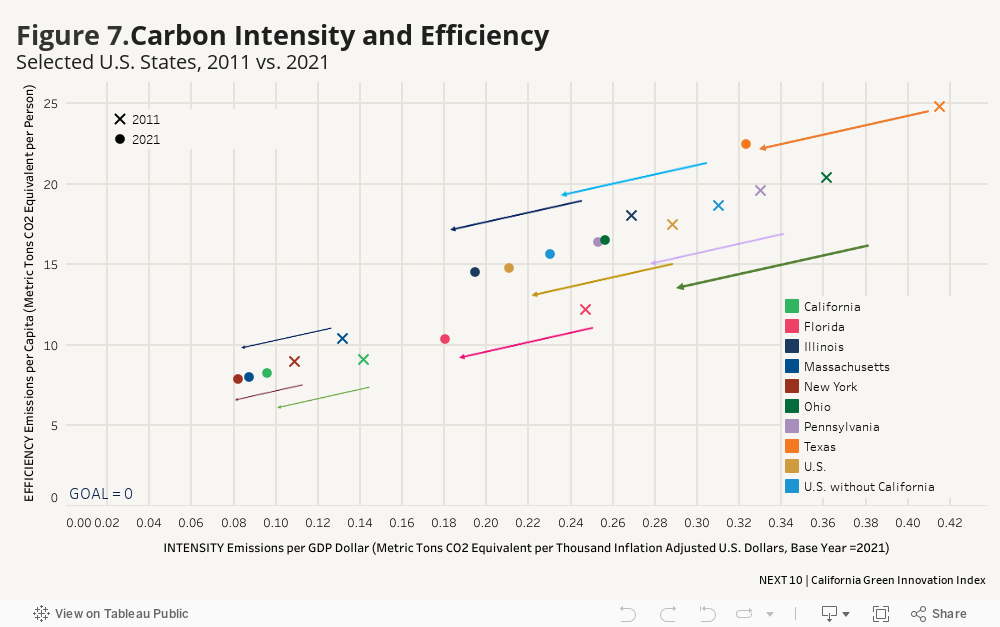
- In 2021 (the latest year for which nationally comparable data is available), $1,000 of economic activity12 in California resulted in 0.10 MTCO2e produced. In comparison, the same $1,000 of economic activity in the U.S. (excluding California) resulted in 0.23 MTCO2e produced—more than double that of California. From 2011 to 2021, California’s carbon intensity decreased by 32.1 percent, ahead of all other most populous states: Texas (-22.1%), Pennsylvania (-23.4%), New York (-24.8%), Florida (-27.0%), Illinois (-27.6%) and Ohio (-29.0%), but behind Massachusetts (-33.5%).
- In addition to performing well in terms of carbon intensity, California also has one of the lowest energy-related GHG emissions per capita levels, with 8.28 MTCO2e per person in 2021, edging out every other big state except for New York (7.86 MTCO2e per person) and Massachusetts (8.03 MTCO2e per person). Comparatively, the U.S. (excluding California) had per capita emission of 15.66 MTCO2e in 2021, representing a 16.0 percent decrease from 18.65 MTCO2e per person in 2011.
12 Inflation-adjusted in 2021 dollars.
More About
Carbon Economy
Related Content