
Data Source: U.S. Energy Information Administration, 2021 State Energy Data System (SEDS).
Analysis by Beacon Economics
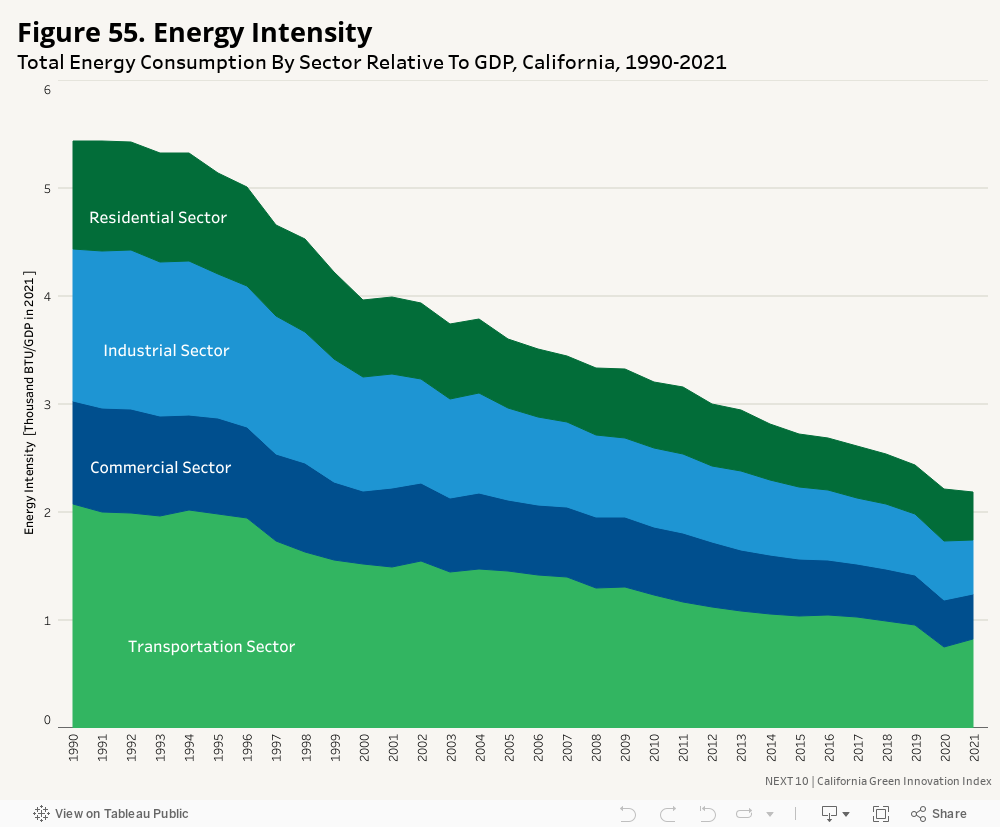
Highlight
- In 2021, California experienced a decrease in energy intensity, which is the ratio of energy input to GDP output, by 1.5 percent compared to 2020. This decrease was lower than the significant drop of 9.0 percent seen in the previous year due to the onset of the pandemic. In 2021, the energy intensity for the residential sector led the way with a 9.4 percent reduction, followed by a 7.5 percent decrease in the industrial sector. In contrast, the transportation sector saw a rebound in energy intensity, with an increase of 9.7 percent from 2020 (which was at a historic low due to the pandemic), marking the end of a consecutive decrease that had been observed since 2016.
Opportunity
- Interestingly, the energy intensity of the residential sector exhibited a reversal in its pattern. The energy intensity of the residential sector saw a year-over-year increase of 6.5 percent from 2019 to 2020—the first time an increase has occurred since the Great Recession. From 2020 to 2021, the sector witnessed a rapid decline of 9.4 percent, the fastest rate since 2000 (decrease by 10.0%).
More About
Energy Efficiency
Related Content