
Data Source: U.S. Energy Information Administration, 2021 State Energy Data System (SEDS).
Analysis by Beacon Economics
Highlight
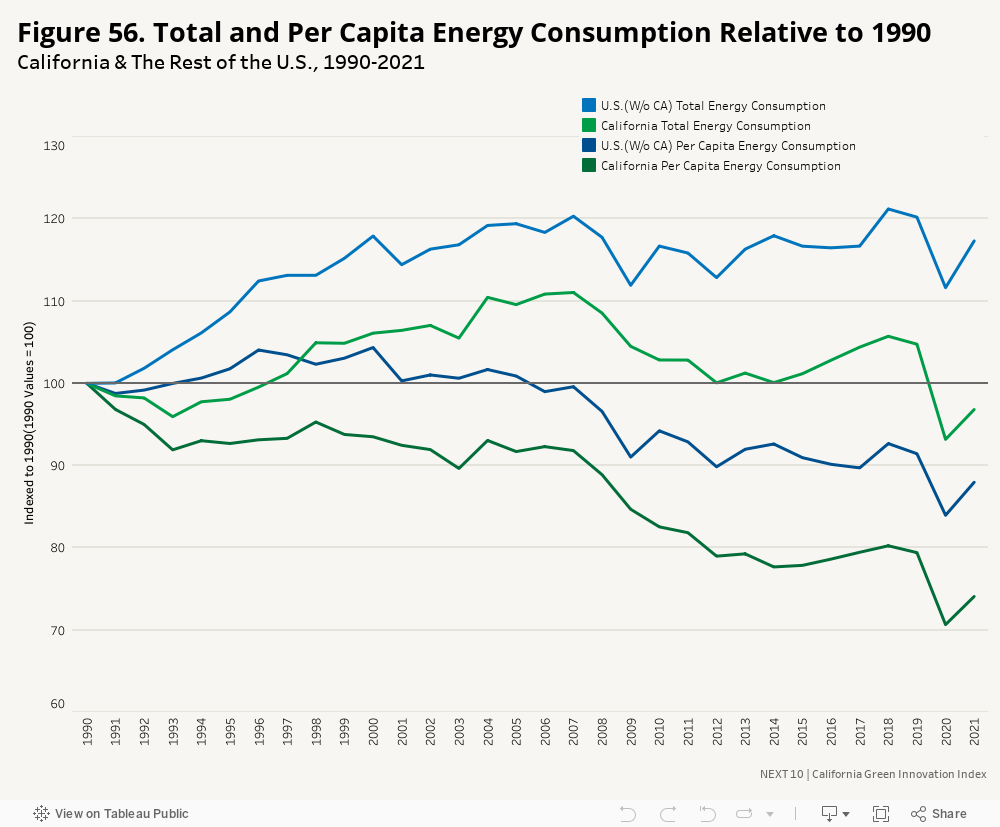
- California’s total statewide energy consumption was 3.8 percent lower in 2021 than in 1990, while energy consumption per capita declined even faster—decreasing by 25.9 percent. Meanwhile, total and per capita energy consumption for the rest of the U.S. were 17.3 percent higher and 12.0 percent lower in 2021 than in 1990, respectively.
Challenge
- The economic rebound in 2021 contributed to the increase seen in both total and per capita energy consumption—especially in the transportation sector (+18.2% from 2020 in California, +11.1% from 2020 in U.S). For the rest of the U.S. (excluding California), total energy consumption and per capita consumption experienced a significant year-over-year increase from 2020 to 2021, increasing by 5.7 percent and 4.0 percent, respectively. Meanwhile, California witnessed a more moderate increase, with total and per capita energy consumption across all sectors rising by 3.6 percent and 3.4 percent from the previous year (2020). This can be attributed to the ongoing economic decline in the commercial (-0.3%) and residential (-2.3%) sectors.
More About
Energy Efficiency
Related Content