
Data Source: California Energy Commission
Note: Other Sectors include Agriculture, Mining & Construction, and Streetlights.
Analysis by Beacon Economics
Highlights
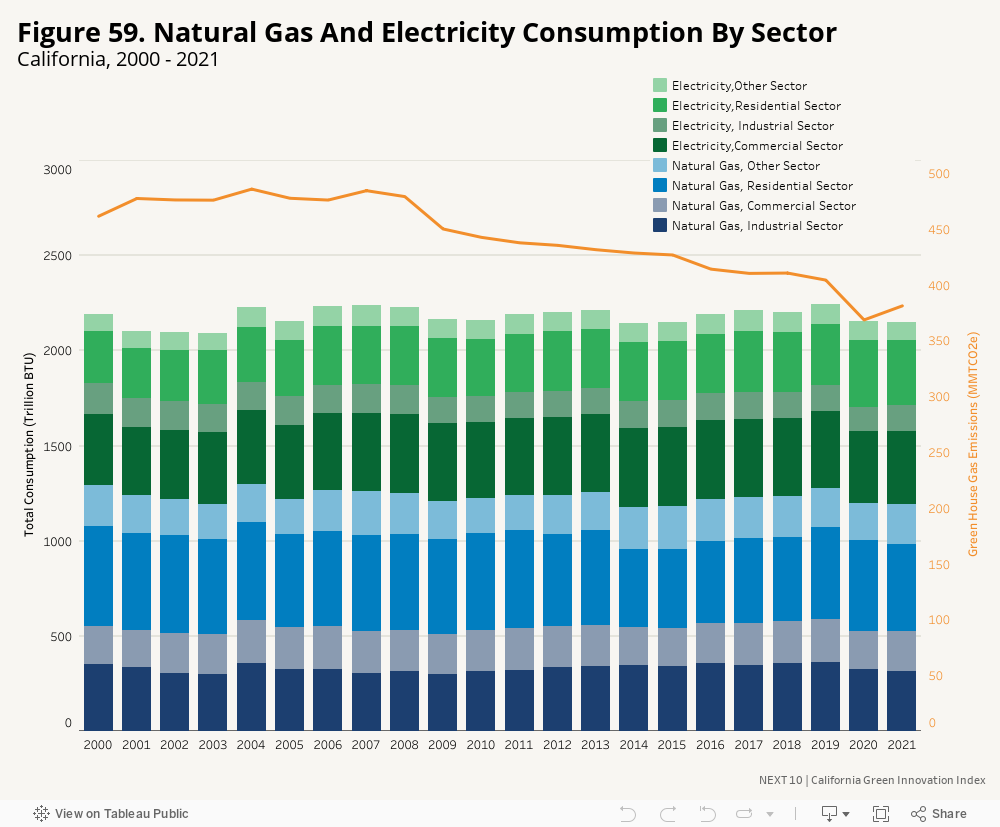
- Between 2020 and 2021, natural gas174 consumption in California experienced a slight decline of 0.5 percent, primarily driven by decreases in the residential and industrial sectors. These sectors saw declines of 3.9 percent and 3.5 percent, respectively. Both the commercial (+5.6%) and ‘other’ (+6.6%) sectors175 rebounded from the previous decrease in 2020. In contrast, total electricity usage in California saw a modest increase of 0.4 percent during the same period. The industrial sector recorded the largest increase, with a growth of 2.8 percent, closely followed by the commercial sector with a 2.5 percent rise. As a result, greenhouse gas (GHG) emissions in the electric power sector rose by 4.8 percent from 2020 to 2021, which is 3.5 percent higher than 2019 emission level. However, when comparing current levels to those of 2001, natural gas consumption has declined by 5.1 percent while electricity consumption in California has increased by 35.3 percent. Among the natural gas consumption end use sectors, consumption in the residential sector (-10.0%) and industrial sector (-5.7%) have decreased their consumption compared to those of 2001. However, natural gas consumption in the commercial sector increased by 6.4 percent and the ‘other’ sector increased by 4.2 percent compared to the 2001 level. Among the electricity consumption end use sector, residential sector (+32.1%), commercial sector (+7.5%) and ‘other’ sector (+8.3%) have increased compared to those of 2001, except the industrial sector (-12.6%). Meanwhile, greenhouse gas (GHG) emissions in the electric power sector were 48.8 percent lower than the 2001 level.
- Fortunately, the residential sector has experienced a positive shift, following years of electrification. Natural gas consumption in the residential sector decreased in both 2020 (-0.3% from 2019) and 2021 (-3.9% from 2020). Natural gas consumption in the residential sector has exhibited an average decrease of 1.2 percent every year since 2011. Additionally, natural gas consumption in the residential sector decreased by 1.2 percent per year from 2011 to 2021, after increasing by 0.1 percent per year from 2001 to 2011. In the commercial sector, it decreased by 0.4 percent per year from 2011 to 2021, after increasing by 1.0 percent per year from 2001 to 2011). However, the ‘other’ sector increased 6.6 percent natural gas consumption from 2020 to 2021—the only sector that increased in 2021. The ‘other’ sector was increasing by 1.2 percent per year from 2011 to 2021, after decreasing by 0.7 percent from 2001 to 2011. Similarly, natural gas consumption in the industrial sector was decreasing slower each year from 2011 to 2021 (-0.2% annually), when compared to 2001 to 2011 (-0.4% annually).
174 Natural gas serving residential household, commercial, transportation, industrial sector, excludes electric power generation sector.
175 Other sectors include Agriculture, Mining & Construction, and Streetlights.
Challenge
- The state has a long way to go in terms of electrification, as natural gas consumption was still 24.4 percent higher than electricity consumption in 2021. Although California has made progress in utilizing electricity more efficiently and transitioning to renewable energy sources, its reliance on natural gas remains a concern. From 2013 to 2021, consumption in several end-sectors remained consistently higher than those recorded in 2001. The commercial and the 'other’ sectors stand out as the largest consumers, surpassing 2001 consumption by 6.4 percent and 4.2 percent, respectively, in 2021. Moreover, based on current consumption patterns, both the commercial and ‘other’ sectors have maintained an average annual increase of 0.3 percent and 0.2 percent, respectively, every year since 2001.
Opportunity
- Per capita natural gas consumption in both the residential and industrial sectors saw a significant decline compared to both 2001 and 2020. In the residential sector, consumption declined by 20.7 percent since 2001, and by 3.0 percent since 2020. In the industrial sector, it declined slightly less—by 16.9 percent since 2001 and 2.6 percent since 2020. Across all sectors, per capita natural gas consumption was 15.4 percent lower in 2021 than in 2001, and 7.7 percent lower than in 2011. Meanwhile, per capita electricity consumption increased by 11.4 percent in 2021 compared to 2001, and increased by 1.3 percent since 2011.
More About
Energy Efficiency
Related Content