Carbon Economy

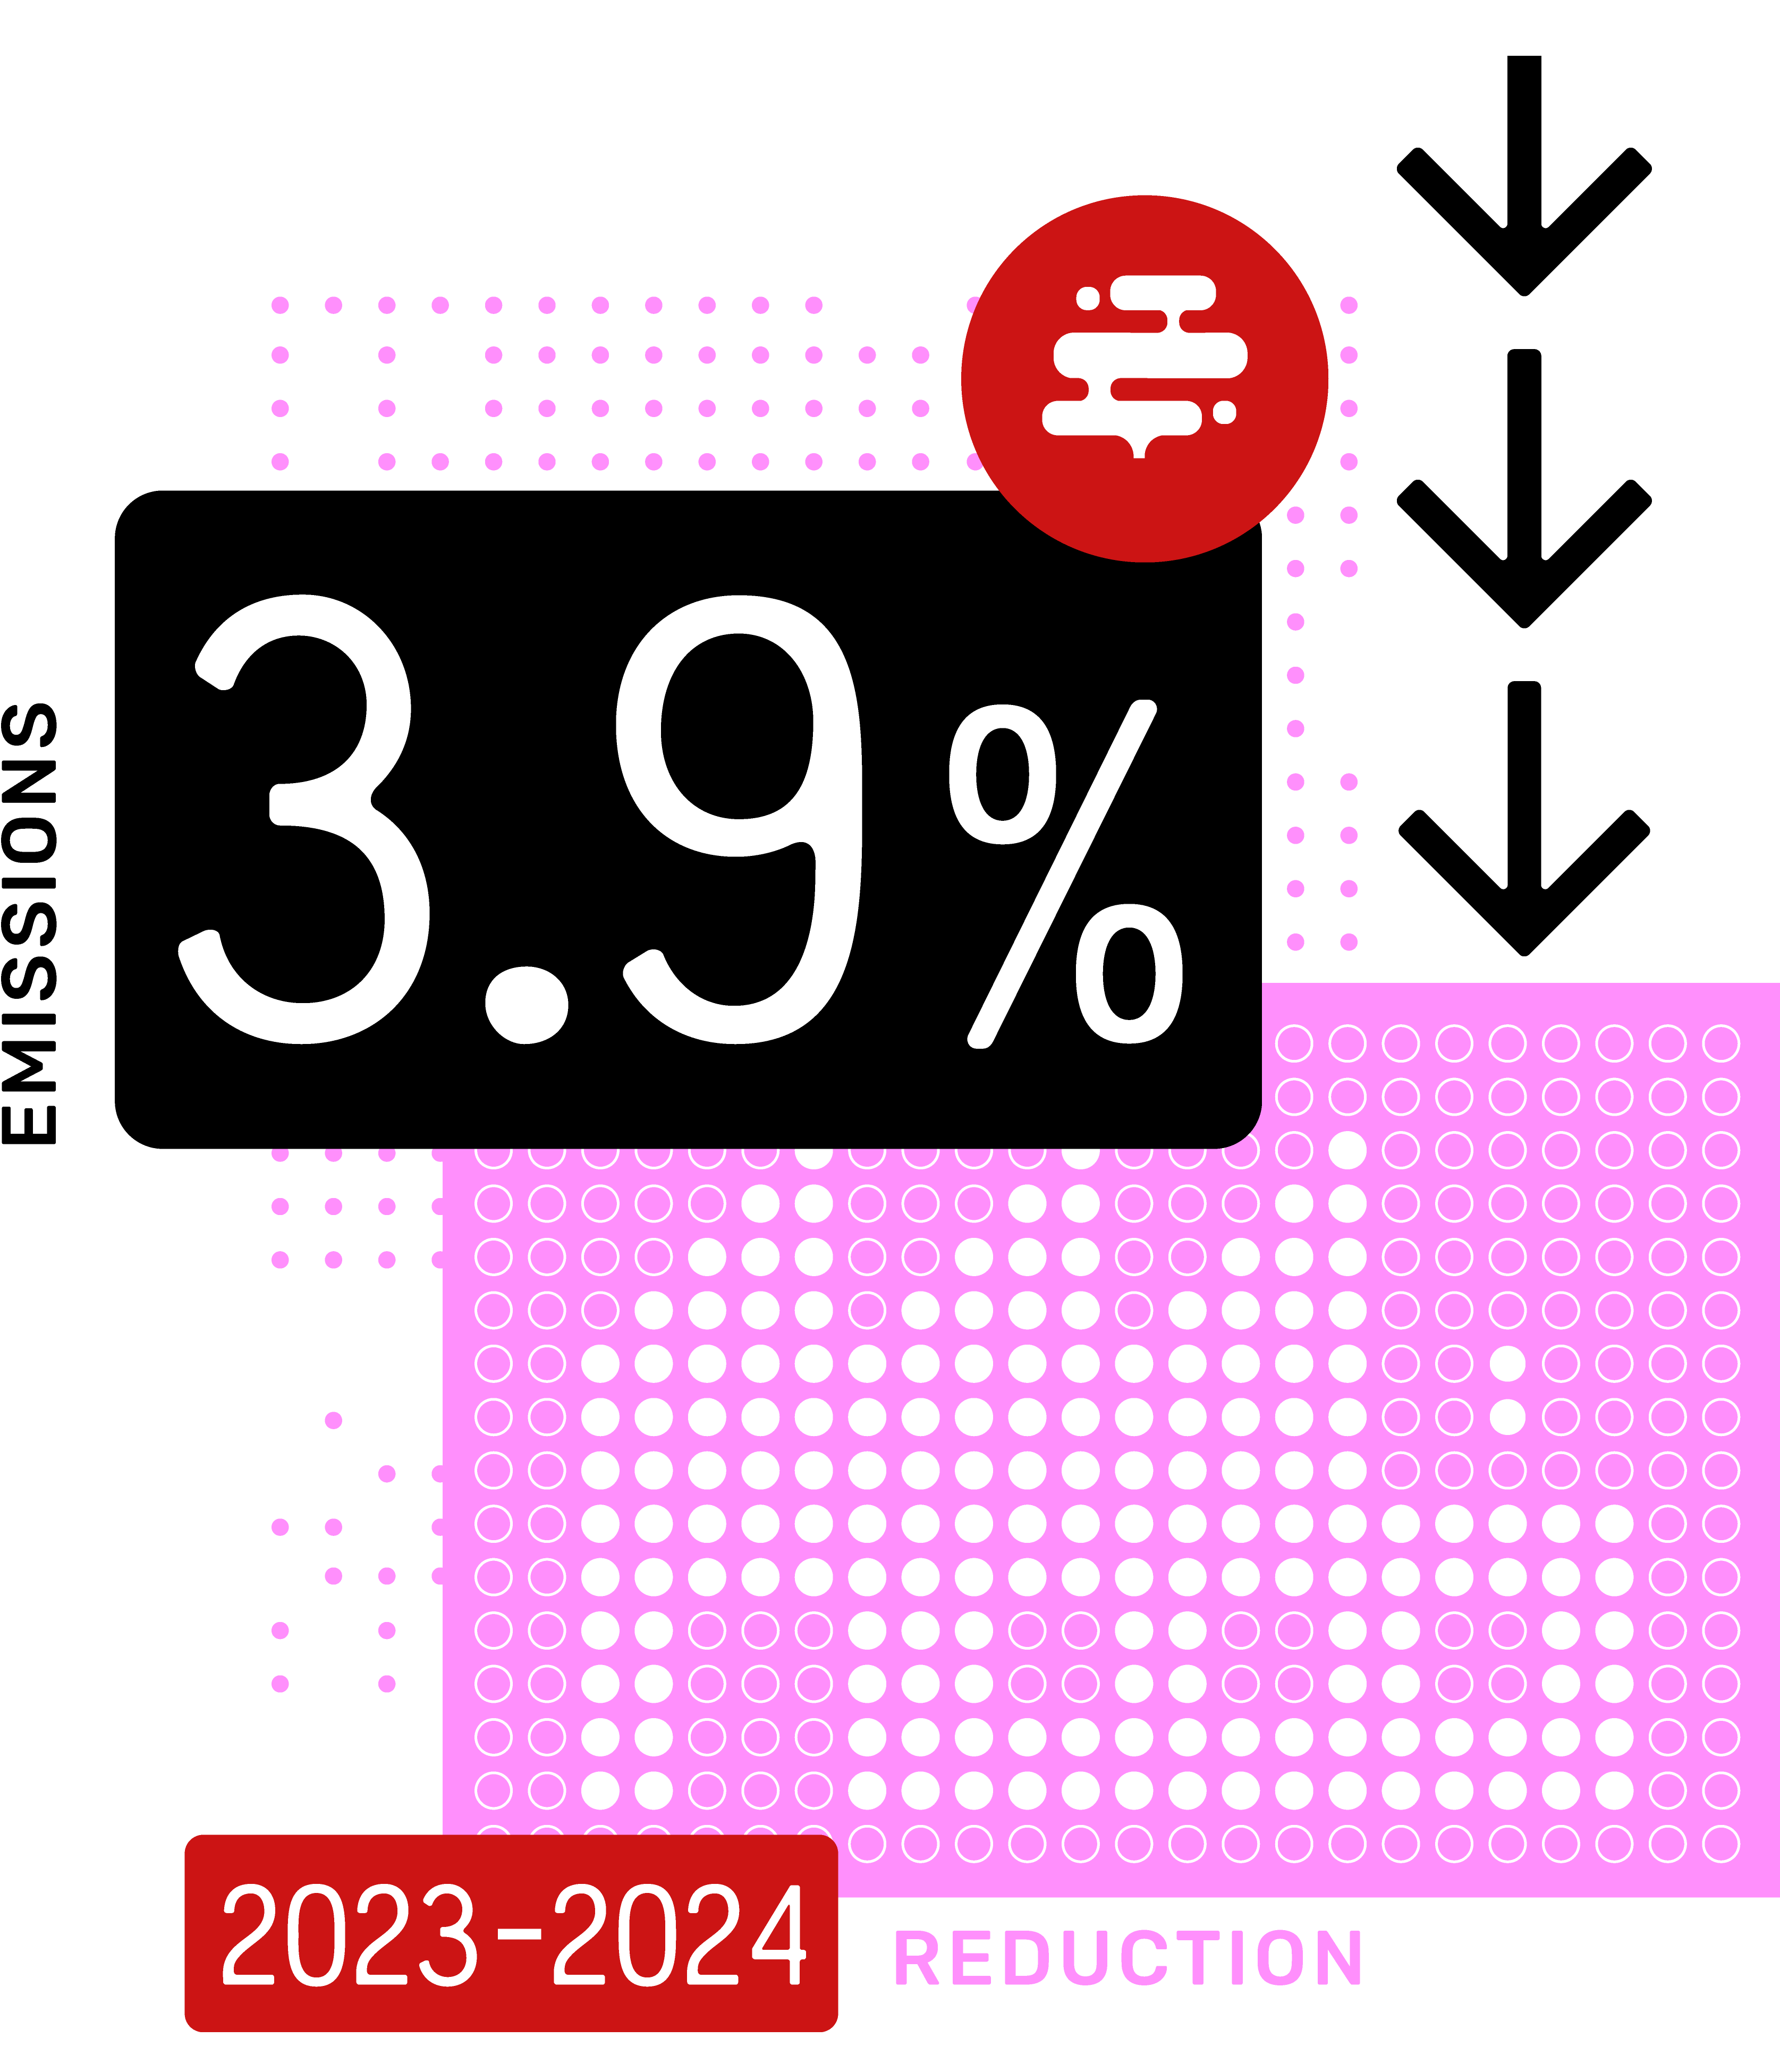
Greenhouse gas (GHG) emissions in California decreased by 3.9% to 346.0 million metric tons (MMTCO2e) in 2024 compared to 2023. More importantly, emissions in 2023 remained 6.3% below emissions in 2020 during the COVID-19 pandemic shutdown — a notable achievement. While this data is encouraging and shows that California is still making progress, the state still needs to do more to meet its climate goals. SB 32 set a goal of reducing GHG emissions by 40% below 1990 levels by 2030, and at 346.0 MMTCO2e, the state’s 2023 emissions were only 19.7% below 1990 levels. The state now needs to reduce emissions at a rate of 4.7% per year to reach the 2030 target of 40% below 1990 levels, which is much higher than the annual rate of emissions reductions recorded historically. From 2019 to 2024, emissions fell at an average rate of just 3.0% per year. Further work will be needed to reduce emissions in harder-to-reach sectors such as transportation, buildings, and the industrial sector.

While the transportation sector remained the largest-emitter, accounting for 38.0% of total emissions in 2024, emissions fell by 4.1% compared to 2023 — the third-largest decrease of any sector. Emissions from in-state electricity generation fell 9.5% (-4.0 MMTCO2e) followed by the residential sector, which fell 8.6% (-3.0 MMTCO2e). However, these decreases were merely reversing the rising emissions from both sectors observed from 2019 to 2023. Electricity sector emissions have seen dramatic reductions since 2006 — 68.1% (-37.2 MMTCO2e) for imports and 25.3% (-12.7 MMTCO2e) for in-state generation. The state has also made notably emission reduction progress in the transportation sector, falling by 29.8% since 2006 (-55.8 MMTCO2e) when AB 32 was passed due to a combination of increasing fuel economy standards, electrifying the transportation sector, and switching to biofuels from petroleum diesel for the heavy-duty vehicle segment in recent years.

While most other sectors are not declining as quickly, they are moving in the right direction. For instance, emissions from the industrial sector fell by 2.9% and from the agricultural sector by 2.5% from 2023 to 2024. The only sector in which emissions increased from 2023 to 2024 was the electricity import sector, where emissions grew by 9.8% due to the increased use of coal to generate electricity in the Southwest region in 2024. Emissions from imports are likely to resume their downward trajectory in 2025 as imports from electricity generated from coal in the Southwest region decreased that year. However, both the commercial and residential sectors are the only sectors where GHG emissions were higher in 2024 than in 2016, when California met the AB 32 goal of reducing GHG emissions to 1990 levels by 2020. The use of substitutes for ozone-depleting substances in refrigeration and air conditioning activities single-handedly accounts for the commercial sector’s increase in emissions.

Nationally, California was the third-most carbon-efficient state (defined as GHG emissions relative to GDP), after New York and Massachusetts in 2024. Among the 50 states, only Maryland had lower per-capita emissions than California in 2024 as well. The state has shown that it is possible to grow the economy, while lowering emissions. Compared to 1990, inflation-adjusted GDP per capita is up 103.7% while GHG emissions per capita are down 39.8% in 2024. Since the passage of AB 32 in 2006, inflation-adjusted GDP per capita increased by 42.7% while GHG emissions per capita dropped by 32.6% in 2024. It will take more action, time, and resources to further decarbonize the economy, but the last couple decades offer hope that California can achieve its climate goals without sacrificing economic growth.
California’s Greenhouse Gas Emissions
  • Total greenhouse gas (GHG) emissions decreased by 14.0 million metric tons of carbon dioxide-equivalent (MMTCO2e) to 346.0 MMTCO2e in 2024—representing a 3.9% decrease compared to 2023.

  • The 2024 GHG emissions were 19.7% below the 1990 level of 431 MMTCO2e and 6.3% lower than the pandemic amount in 2020.

  • The transportation sector continues to be the largest-emitting sector in California, comprising 38.0% of the total emissions in 2024. This is down 4.1% (-5.6 MMTCO2e) from 2023.

  • Compared to the GHG emissions in 2023, among the economic sectors, the in-state electricity generation sector experienced the largest reduction, decreasing by 9.5% (-4.0 MMTCO2e), followed by the residential sector, which fell by 8.6% (-3.0 MMTCO2e).

  • Emissions from the industrial sector fell by 2.9% (-2.2 MMTCO2e) and the agriculture sector fell by 2.5% (-0.7 MMTCO2e) from 2023 to 2024.

  • GHG emissions from electricity imported from neighboring states increased by 9.8% (+1.6 MMTCO2e) from 2023 to 2024, reversing the previous drop from 2022 to 2023.

  • Emissions from the electric power sector overall were 4.1% (-2.4 MMTCO2e) lower in 2024 than in 2023.

  • The residential and commercial sectors were the only sectors where GHG emissions were higher in 2024 than in 2016 when California met the AB 32 goal of reducing GHG emissions to 1990 levels by 2020.

  • California needs to reduce its GHG emissions by 87.6 MMTCO2e in the next six years to reach the Senate Bill 32 target of 40% below 1990 level by 2030, or an average pace of 14.6 MMTCO2e per year from 2024 to 2030.

  • The 14.0 MMTCO2e decrease from 2023 to 2024 is the largest year-over-year reduction outside of 2008-2009 and 2019-2020 — both recession years.

California’s Greenhouse Gas Emissions Reduction Progress and Outlook
  • GHG emissions have fallen by over 100 MMTCO2e since the turn of the century. From 2000 to 2024, GHG emissions decreased by 24.6% (-112.7 MMTCO2e).

  • Based on 2024 emissions, the state must reduce emissions by 4.7% each year to meet the SB 32 goal of 40% below 1990 levels by 2030. This is a slight increase compared to the 4.5% annual decrease required in 2023 and the 4.2% annual decrease required in 2022.

  • At the current annual average rate of reduction from 2019 to 2024 of 3.0% each year, the state would meet its 2030 goal in 2034.

  • California recently revised its emissions goal of 80% below 1990 levels by 2050 to 85% below 1990 levels by 2045. This means that even if California manages to meet the SB 32 target by 2030, the state would need to reduce its emissions at a pace of 8.8% per year to reach the goal by 2045—nearly double the pace required to meet the 2030 target.

  • Using the average annual reduction of 3.0% from 2019 to 2024 instead of assuming the state meets the 2030 goal on time, the average annual reduction rate would need to be 9.5% from 2030 to 2045 to meet the 2045 goal on time.

California’s Carbon Economy
  • In California, GHG emissions per capita fell by 4.3% (-0.40 MMTCO2e/person) from 2023 to 2024, while the state’s inflation-adjusted GDP per capita grew by 2.7% over the same time period.

  • Compared to 2019, GHG emissions per capita in 2024 were down by 14.2% (-1.45 MMTCO2e/person), while the inflation-adjusted GDP per capita in 2024 was up by 11.6%.

  • From 2014 to 2024, California’s energy intensity decreased by 32.4%, more than the rest of the U.S. (-30.3%) and ahead of other most populous states except for Florida (-33.5%): Texas (-27.8%), Pennsylvania (-27.6%), New York (-22.3%), Massachusetts (-29.3%) and Michigan (-25.5%)

  • In addition to performing well in terms of carbon intensity, California also has one of the lowest energy-related GHG emissions per capita levels, with 8.0 MTCO2e per person in 2024—edging out every other big state including New York (8.2 MTCO2e per person), which historically has had slightly lower per capita emissions than California.

  • For the first time, from 2023 to 2024, the carbon intensity of California’s energy supply (kilograms of CO2 per million British thermal unit) fell below 50 kg CO2 per million BTU, dropping by 2.0%, while that of the U.S. decreased by 1.0%.

Greenhouse Gas Emissions by Sector: Challenges & Opportunities
  • Within the transportation sector, emissions from on-road vehicles, which make up 90% of transportation’s emissions, were 4.5% (-5.5 MMTCO2e) lower in 2024 than in 2023. Within the on-road vehicles sub-sector, emissions from heavy-duty vehicles declined by 17.5% (-4.0 MMTCO2e) from 2023 levels, while emissions from passenger vehicles declined by 1.4% (-1.4 MMTCO2e).

  • Emissions from other transportation subsectors (aviation, rail, ships, other, and not specified) fell by 1.7% (-0.2 MMTCO2e), from 2023 to 2024.

  • The majority of the recent decreases in transportation sector emissions came from the heavy-duty vehicles sector, which fell by almost half (-15.5 MMTCO2e or -44.9%) in just five years from 2019.

  • In 2024, renewable diesel totaled 2,738 million gasoline gallon equivalent (GGE), an increase of 538.8 GGE or 24.5% compared to 2023.1

  • The GHG emissions per unit of transportation fuel consumed were 6.13 MMTCO2e/hundred trillion BTU in 2024, down 2.6% from 2023.

  • Californians exported or sent 39.6 million tons of waste to landfills in 2024, down 2.2 million tons (-5.3%) from 41.6 million tons in 2023.

  • Landfill emissions from included emissions (from landfill gas generation) were 8.1 MMTCO2e in 2024, down 0.7% (-0.06 MMTCO2e) from 2023. Landfill emissions from biogenic materials were 5.8 MMTCO2e in 2024, up 0.2% (+0.01 MMTCO2e) from 2023.

  • Emissions from the use of substitutes for ozone-depleting substances (SODS), which emit high global warming potential (GWP) gases such as hydrofluorocarbons (HFCs) and perfluorocarbons (PFCs), are the fastest-growing source of GHG emissions in California.

  • For the first time, in 2024, GHG emissions from SODS from all economic sectors accounted for over six percent (6.1%) of the total included statewide emissions, up from 5.8% in 2023.

  • By end-use sectors, in 2024, emissions from SODS fell in the transportation sector (-4.0%) and industrial sector (-0.1%) compared to 2023, but rose in the residential sector (+4.6%) and the commercial sector (+0.9%).

  • From 2007 to 2024, the residential sector’s share of emissions from SODS has risen from 7.3% to 26.8%, and from 30.9% to 44.7% for the commercial sector.

  • From 2008 to 2024, emissions from the commercial retail sub-sector rose by 58.1% and emissions from the industrial solid waste treatment from composting activities increased by 52.7%.

Footnotes

1 GGE is the amount of alternative fuel it takes to equal the energy content of one liquid gallon of gasoline. Alternative motor fuels may be sold by gasoline gallon equivalent (GGE).