Energy Efficiency

California has long been recognized as a paragon in energy efficiency. The Golden State was the first state to adopt efficiency standards for appliances and equipment (Title 20) in the 1970s, for televisions in 2010, and for battery chargers in 2012.97 Over the last 50 years, California has adopted standards on more than 50 products, many of which have subsequently become federal standards. Beyond appliances, California also has some of the most comprehensive energy efficiency standards, programs, and policies for buildings, transportation, and utilities. California was one of the first states to establish a standard interconnection policy for distributed energy generation (Rule 21) in 2000, which has been adopted as a model by all three major investor-owned utilities (IOUs)—Pacific Gas & Electric, Southern California Edison, and San Diego Gas & Electric.98

At the federal level, the Biden administration allocated significant funding for energy efficiency upgrades through the Inflation Reduction Act (IRA) of 2022. These tax credits were available for home upgrades including home energy audits, heat pumps, solar panels, water heaters, energy-efficient appliances, battery storage, and improvements to windows, doors, skylights, insulation and electrical panels.99 However, the federal budget bill H.R.1, passed in July 2025, eliminated those credits beginning in 2026.100

At the state level, Governor Newsom proposed a statewide zero-emissions appliance standard through the California Air Resources Board (CARB) that would increase the sale of heat pumps and set targets of 6 million heat pumps in buildings and 3 million climate-ready and climate-friendly homes by 2030. Moreover, the California Public Utilities Commission (CPUC) took a groundbreaking step by eliminating subsidies for new gas system connections which took effect in July 2023—making California the first in the nation to take such action. The California Energy Commission also released the 2025 Building Energy Efficiency Standards which expand the use of heat pumps in newly constructed residential buildings, encourage electric-readiness, strengthen ventilation standards to improve indoor air quality, and more. These standards are intended to facilitate energy-efficient approaches to encourage building decarbonization.101 The 2025 Energy Code went into effect for buildings whose permits are submitted beginning January 1, 2026.

While California achieved significant milestones in 2025, it is important to maintain momentum. The state has set ambitious targets under SB 350, aiming to double its statewide energy efficiency savings by 2030.102 Specifically, SB 350 sets targets for California to double the energy efficiency in the residential, commercial and industrial sectors while also increasing our share of electricity from renewable sources to 50% by 2030.103 This underscores the need for continued efforts and investments in energy efficiency and other practices to ensure a sustainable and resilient energy future for the state.
Energy Productivity
  • California has the third-highest energy productivity in the U.S. (fourth highest if including District of Columbia), generating $5.90 of GDP in 2024 (in 2024 dollars) for every 10,000 British Thermal Units (BTU) of energy consumed.

  • California has continuously outperformed the rest of the U.S. in terms of energy efficiency gains as a share of GDP produced—averaging a 3.4% compounded average growth rate (CAGR) between 2014 and 2024 compared to the 2.5% CAGR recorded for the rest of the U.S. during the same period.

  • California’s energy productivity growth has slowed down compared to pre-2020. Continued setbacks could jeopardize the state’s chance of meeting the SB 350 targets, which include requiring California to double statewide energy efficiency savings.104

Energy Intensity
  • Energy intensity resumed its declining trend as the pandemic fades further into the rearview, falling 2.5% in 2024 relative to 2023. The rate of decline is similar to that of 2023 relative to 2022 but lower than the declining rates from the 2010s.

  • Energy intensities of the residential sector and the industrial sector declined by 4.7% and 6.1%, respectively, in 2024 relative to 2023 and 30.5% and 41.7% lower than in 2014, respectively.

  • Energy intensity of the commercial sector has stopped declining at a significant pace, falling only 0.8% from 2023 to 2024. Energy intensity of the transportation sector remained stable from 2023 to 2024.

Electricity and Energy Consumption
  • California’s total statewide energy consumption was 3.7% lower in 2024 than in 1990, despite the state being 31% more populous. However, statewide energy consumption rose 0.6% from 2023 to 2024.

  • Energy consumption per capita was 26.7% lower in 2024 than in 1990 in California compared to 14.8% lower in the rest of the U.S.

  • Relative to 2015, the year that Senate Bill 350 became law, California’s total statewide and per capita energy consumption in 2024 were only 4.0% and 5.1% lower, respectively.

  • Renewable energy consumption growth continues to outpace that of fossil fuels and other sources for both electric and non-electric consumption, growing by 58.6% and 151.2%, respectively, between 2014 to 2024.105

  • For electricity consumption, solar and wind posted significant one-year increases—up 18.1% and 11.6%, respectively, from 2023 to 2024. For non-electricity consumption, solar energy grew 11.5% from 2023 to 2024.

  • From 2023 to 2024, renewable electricity consumption grew 3.4% and renewable non-electricity consumption grew 13.8%, in stark contrast to fossil-fuel electricity consumption (-10.2%) and fossil-fuel non-electricity consumption (-1.9%).

  • Total energy consumption was 13% lower in 2024 than in 2007 and 4% lower than in 1990.

  • Total electricity consumption was 8% lower in 2023 than in 2008 but 16% higher than in 1990.

  • From 2023 to 2024, energy consumption per capita fell 3.6% in the industrial sector and 2.1% in the residential sector but rose 2.1% in the transportation sector.

  • The transportation sector’s increase is entirely driven by renewable diesel consumption, which doubled from 217 trillion BTU in 2022 to 427 trillion BTU in 2024.

  • In curbing natural gas consumption, the various sectors have yielded mixed results since SB 350 became law in 2015. From 2015 to 2024, natural gas consumption fell 6.2% but total electricity consumption rose 0.4%.

  • During the same period, natural gas consumption rose 3.9% in the residential sector and 5.8% in the commercial sector while falling 9.5% in the industrial sector and 28.5% in the miscellaneous sectors, which consists of agriculture, mining & construction, and streetlights.

  • During the same period, electricity consumption fell in the industrial (-11.8%) and commercial (-4.1%) sectors and rose in the residential (+11.0%) and the miscellaneous sectors (+1.1%).

  • From 2023 to 2024, total natural gas consumption from all sectors fell 7.2% while electricity consumption rose 2.2%.

Electricity and Energy Consumption Comparisons
  • In 2024, California tied with Hawaii for the lowest per capita electricity consumption (6.24 megawatt-hours) among all 50 states.

  • Comparatively, California’s per capita electricity consumption is about half of the rest of the U.S. (12.4 MWh) and less than 40% of Texas (16.1 MWh).

  • Compared to its peak consumption in 2008, per-capita electricity consumption in California was 14.8% lower in 2024, falling faster than the rest of the U.S. (-6.1% from 2007 to 2024).

  • California’s residential electricity per capita usage of 2.2 megawatt-hours (MWh) was the second lowest in the country in 2024, higher than only Hawaii (1.8 MWh).

  • From 2014 to 2024, California’s electricity consumption per capita in the residential sector fell 5.8% compared to just 1.3% in the rest of the U.S.

  • California’s energy consumption per capita (which includes electricity) was 174.2 million BTU in 2024, the third lowest after Rhode Island (169.2 million BTU) and New York (169.8 million BTU).

  • California’s energy consumption per capita has fallen by 63.5 million BTU (-26.7%) compared to its peak in 1990.

Electricity and Energy Bills Comparisons
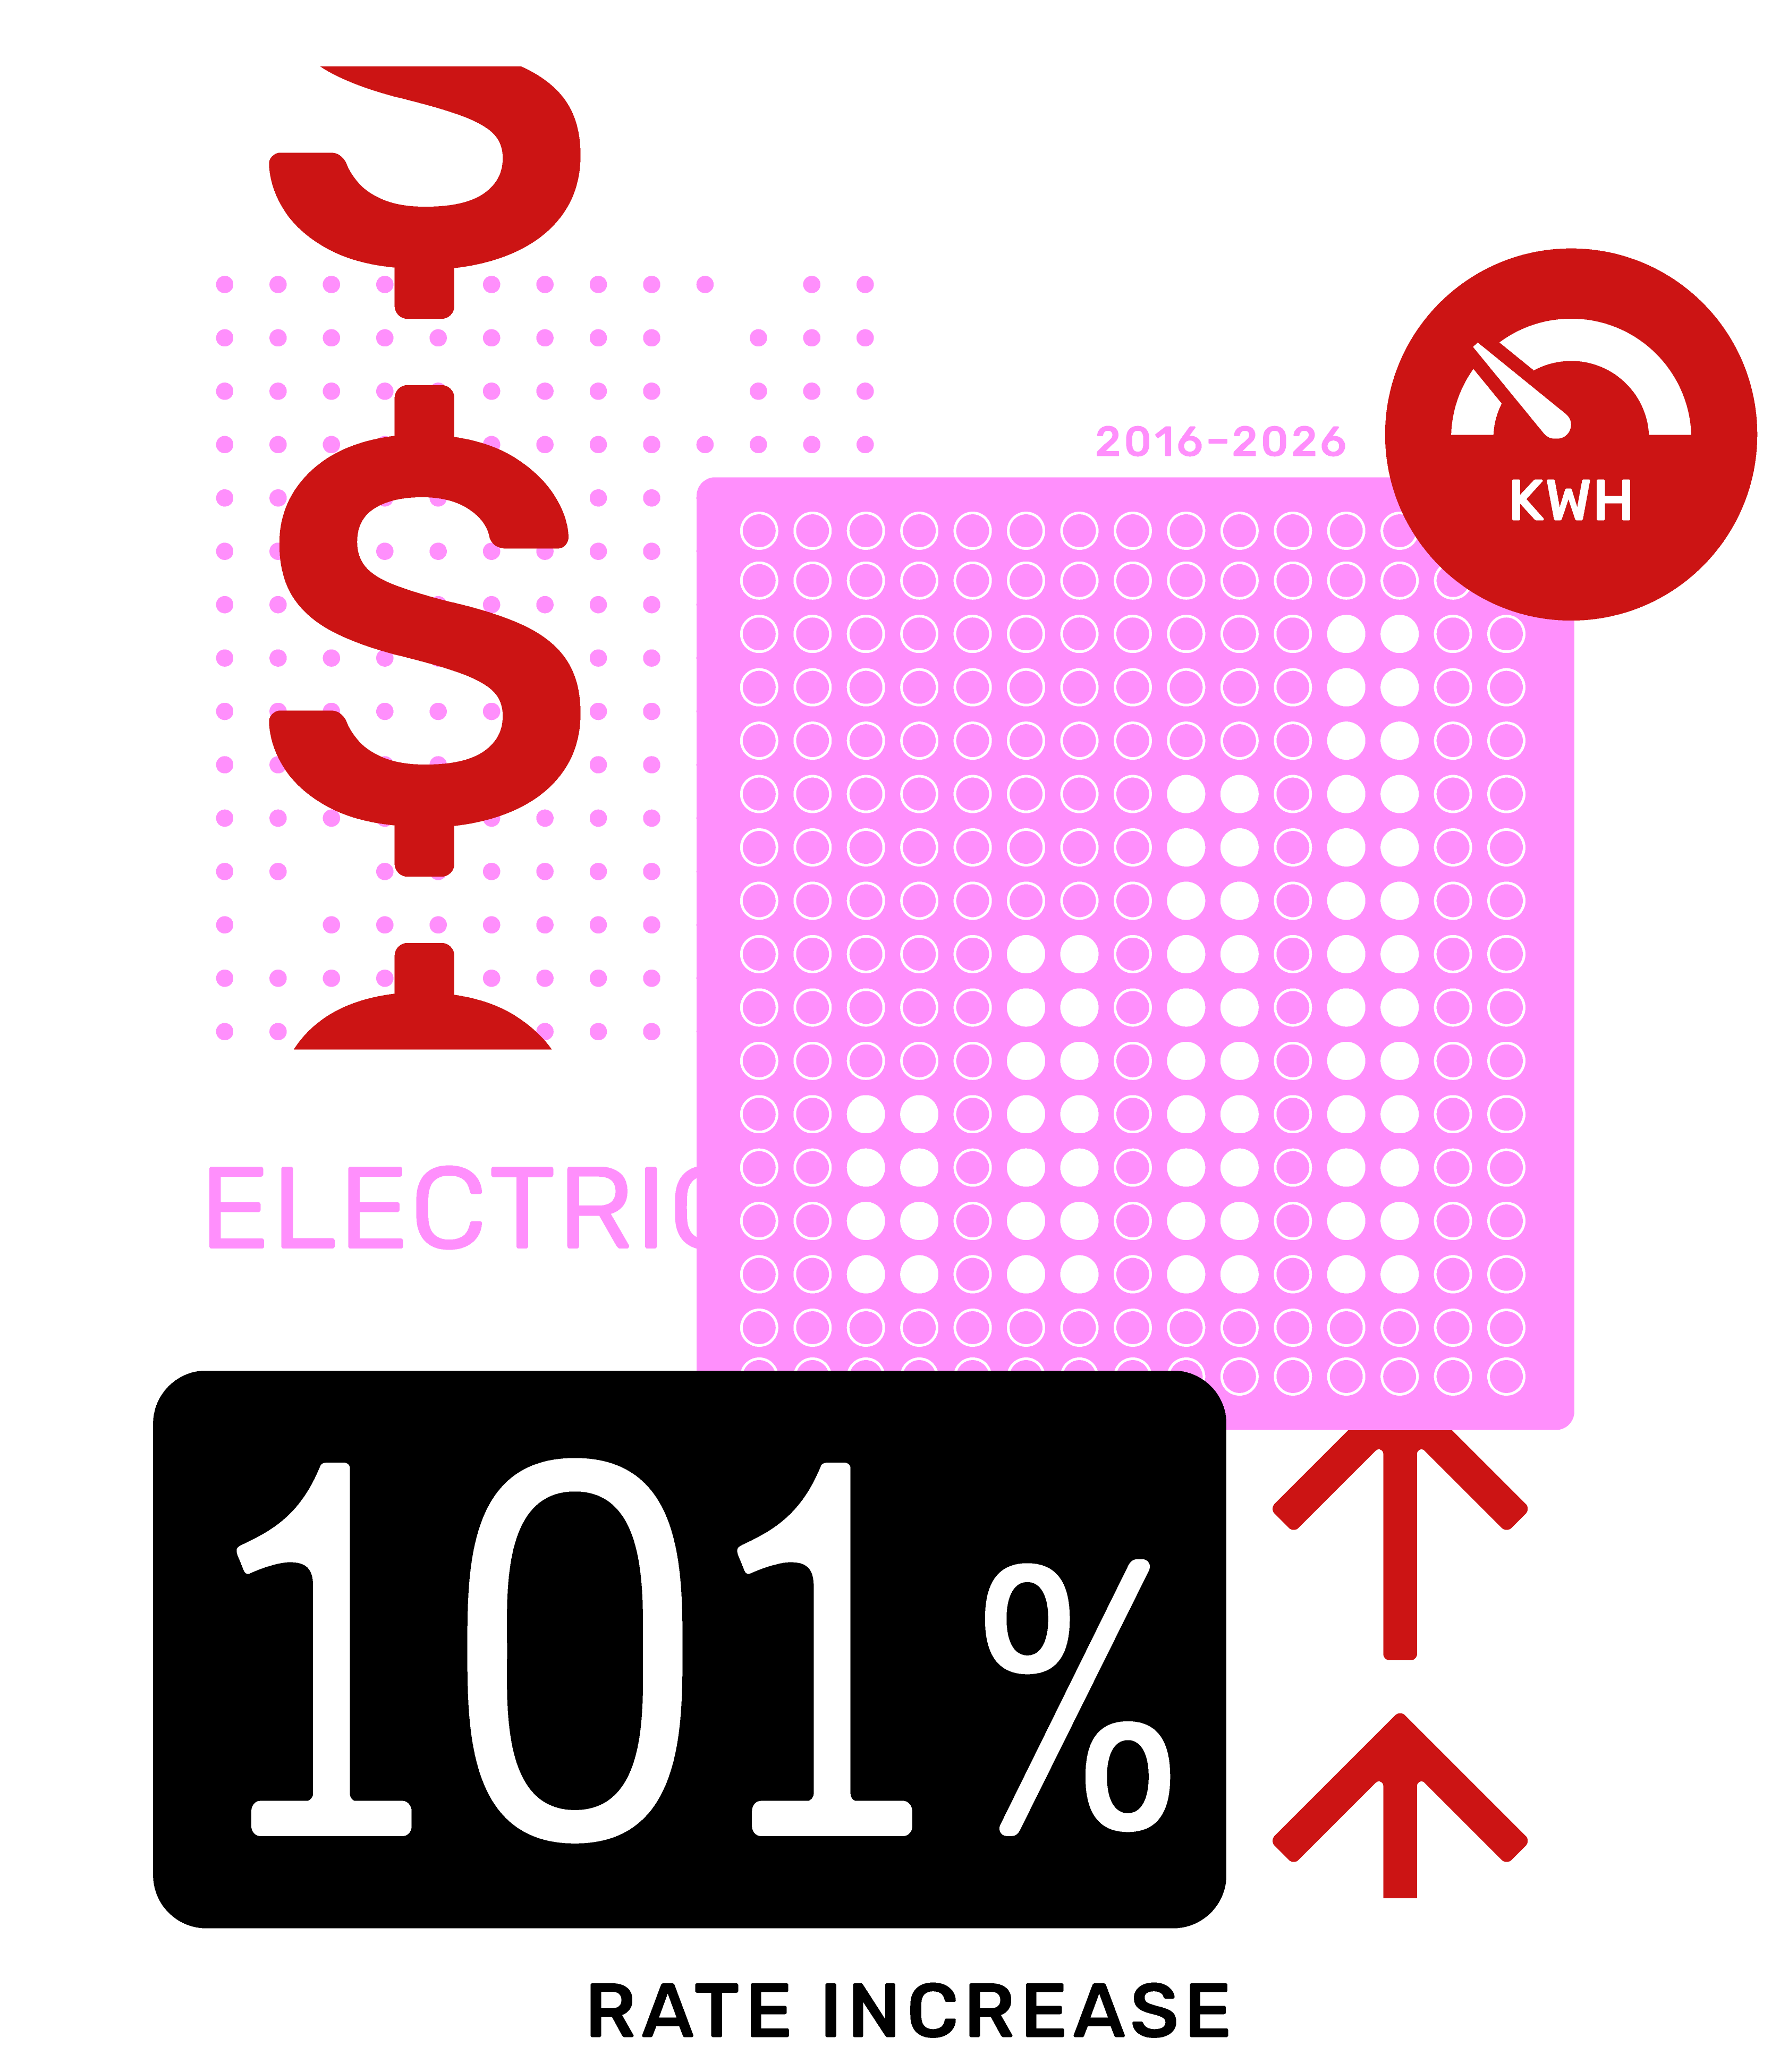
  • California’s electricity bill as a percentage of GDP was 1.63% in 2024, up 0.1% from 2023 and the highest since 2014.

  • California’s ranking in terms of the lowest electricity bill as percentage of GDP has slipped further to 12th place in 2024 from ninth place in 2023. California’s slip in the rankings is due to having one of the highest electricity costs per kilowatt-hour (kWh) in the U.S.

  • California’s energy expenditures fell 0.3% from 5.1% of GDP in 2023 to 4.8% of GDP in 2024. However, California’s energy expenditure relative to GDP was similar to 2015 level while the share had fallen from 6.4% in 2015 to 5.2% in 2024 in the rest of the U.S.

  • In terms of energy expenditures relative to GDP, California fell outside of the top ten for the first time with the 12th lowest energy expenditure relative to GDP in 2024.

  • In 2025, California had the eleventh-lowest average monthly electricity bill for industrial customers with the average monthly bill in California ($5,061) being 21.1% lower than the U.S. average.

  • Because of the high electricity costs per kWh, California’s average electricity bills in the commercial and residential sectors were 66% and 3% higher than those of the U.S. averages, respectively.

  • California has some of the highest electricity costs per kWh—second-highest in residential ($0.39/kWh), commercial ($0.35/kWh), and industrial ($0.30/kWh) sectors —behind only Hawaii.

  • California's average monthly commercial electricity bill ($1,374) was much higher than the U.S. average ($821), surpassed by only Hawaii ($1,380 per month) and Virginia ($1,439 per month).

  • California households also had higher than average residential electricity bills in 2025, averaging $153 per month compared to $147 U.S. average. However, this is lower than the $161 average monthly bill in 2024.

Energy Transition in Residential Buildings
  • In 2024, utility gas was the primary source for home heating in 40 of California’s 58 counties, down slightly from 41 counties in 2023. Electricity was the most common primary source in seven counties in 2024, up from just four counties in 2023.

  • 8.36 million California households used electricity as the main heating fuel source, up 0.5% from 8.32 million households from 2023.

  • Utility gas remains the dominant heating fuel source in California, accounting for 68.3% of owner-occupied households in 2024 (down from 69.0% in 2023) and 50.8% of renter-occupied households in 2024 (up from 50.3% in 2023).

  • 4.15 million California households used electricity as the main heating fuel source, up 2.5% from 4.05 million households from 2023.

  • The share of renter-occupied households using electricity (40.5%) as the heating fuel source is about double that of owner-occupied households (21.9%) in 2024.

Energy Efficiency Savings Comparisons
  • In 2024, electric utilities in California reported incremental annual energy savings of 2.33 million megawatt-hours, down 18.7% compared to the amount of incremental annual savings reported in 2023 (2.86 million MWh) and the lowest since 2013.

  • The reported savings amounted to less than one percent (0.95%) of total electricity consumption, also a historic low since 2013. By comparison, the incremental annual savings relative to total energy consumption in the rest of the U.S. was 0.58% in 2024.

  • California’s incremental life cycle savings reported from utilities has also been on a downward trend with just 24.5 million MWh in 2024. This is down 21% from 2023’s 31.0 million MWh reported and less than half of 2016’s 52.4 million MWh reported.

  • The commercial (42.4%) and residential sectors (52.1%) accounted for the lion’s share of incremental annual savings in 2024. The industrial sector accounted for the remaining 5.5%.

  • Incremental annual electricity savings fell 16.7% from 1.45 million MWh in 2023 to 1.21 million MWh in 2024 for the residential sector. In the commercial sector, incremental annual electricity savings fell 23.4% from 1.29 million MWh in 2023 to 0.96 million MWh in 2024.

Footnotes

97 American Council for an Energy-Efficiency Economy (ACEEE). State and Local Policy Database. December 2022. Accessed July 5, 2024. Retrieved from: https://database.aceee.org/state/california

98 California Public Utilities Commission (CPUC). Electric Rule 21: Generating Facility Interconnections. Accessed July 5, 2024. Retrieved from: https://www.cpuc.ca.gov/Rule21/

99 “Did you dawdle on installing solar panels or buying an EV? Better move fast to get those tax credits.” Associated Press. September 22, 2025. Available at: https://apnews.com/article/inflation-reduction-act-tax-credits-expiring-cc32cb47fc12b509b342ad9230bb38fc

100 Rewiring America. Available at: https://homes.rewiringamerica.org/save

101 “2025 Building Energy Efficiency Standards.” California Energy Commission. Available at: https://www.energy.ca.gov/programs-and-topics/programs/building-energy-efficiency-standards/2025-building-energy-efficiency

102 “Clean Energy and Pollution Reduction Act – SB 350.” California Energy Commission. Available at: https://www.energy.ca.gov/rules-and-regulations/energy-suppliers-reporting/clean-energy-and-pollution-reduction-act-sb-350

103 “California Doubles Down on Energy Efficiency with Passage of SB 350.” Microgrid Knowledge. September 13, 2015. Available at: https://www.microgridknowledge.com/uncategorized/article/11432823/california-doubles-down-on-energy-efficiency-with-passage-of-sb-350

104 California Energy Commission. Clean Energy and Pollution Reduction Act – SB 350. Available at: https://www.energy.ca.gov/rules-and-regulations/energy-suppliers-reporting/clean-energy-and-pollution-reduction-act-sb-350

105 This includes biodiesel and fuel ethanol as well as non-RPS eligible sources such as conventional hydroelectric. The State Energy Data Systems (SEDS) does not distinguish conventional hydroelectric from small hydro.