Renewable Energy

California has set ambitious renewable energy and decarbonization goals, including a target to reach carbon neutrality by 2045. The state passed Senate Bill (SB) 1020—the Clean Energy, Jobs, and Affordability Act of 2022—in August 2022, which set interim targets of 90% clean electricity by 2035 and 95% by 2040 on the way to carbon neutrality by 2045.54 While California passed Assembly Bill (AB) 1373 that would support the development of the offshore wind industry in September 2023, the Trump administration has aggressively moved to block offshore wind projects across the country, including those that are already operational and sending power to the grid.55, 56 The administration has also been attempting to buy out existing offshore wind leases, including three of the five leases off the California coast — Golden State Wind, Canopy Offshore Wind Project, and Even Keel Wind — that collectively represent 5.6 GW of total potential capacity and would power over 2 million homes with clean energy.57 At the end of September 2026, the Attorneys General of California and a coalition of New England states sued the federal government to block the buyouts.58

In 2025, California increased the share of electricity generation (in-state generation and imports) from renewable sources by 4.0% — a significant achievement after the previous year’s record increase of 4.4%. Renewables accounted for 45.3% of generation in 2025, compared to only 41.3% in 2024 and 36.9% in 2023. Meanwhile, generation from fossil fuels fell to 32.1% in 2025, a drop of 4.2% and the lowest share of the power mix on record. This is half of the 63.9% it was in 2008 and significantly lower compared to 41.1% only a few years ago in 2021. This is a remarkable achievement that speaks to California’s long-time commitment to policies that increase the state’s deployment of renewables while reducing reliance on fossil fuel sources.

At the federal level, California faces a new roadblock in expanding its renewable energy capacity. The federal budget bill H.R.1, passed in July 2025, eliminated the Investment Tax Credit (ITC) for utility-scale wind and solar projects that was created in the Inflation Reduction Act (IRA) of 2022. Projects that started construction one year after H.R.1 was enacted, July 4, 2026, were still eligible for the ITC and must be placed in service by the end of 2027.59

As California looks to decarbonize by 2045 and transition toward greater utilization of clean electricity sources, there has been accelerating momentum to electrify buildings, homes, and modes of transportation. At the same time, electricity demand is growing for other uses, such as new data centers that are coming online to power artificial intelligence platforms. For example, more than 3.5 GW of data center capacity is due to come online in California between now and 2029 in PG&E’s territory.60 As California continues to press forward in its commitment to propel the clean energy transition, the state’s power grid will face considerable strain and more renewable energy will need to be deployed faster in order to keep up with surging demand for electricity.

Renewable Electricity Generation and Power Mix
  • In 2025, the percentage of total power mix (in-state generation plus imports) from renewable sources increased to 45.3%, a 4.0% increase compared to 2024.61

  • California maintains a significant lead in renewables, with an average yearly growth rate of 2.0% from 2008 to 2025, compared to the rest of the U.S. growth rate of 0.9%.

  • Solar and wind are the largest renewable sources, making up 24.8% and 12.4%, respectively, of the state’s total power mix.

  • Electricity generation from RPS-eligible renewables increased by 5.5% from 2024 to 2025. Particularly, generation from solar (in-state generation and imports) rose 12.1% compared to 2024. Generation from wind barely increased (+0.2%).

  • Generation from biomass (-8.6%) and small hydro (-18.7%) fell in 2025 compared to 2024.

  • California imported 11,349 GWh of electricity from RPS-eligible renewables from the Northwest and 20,551 GWh from the Southwest regions in 2025, up 523 GWh (+4.8%) and 2,159 GWh (+11.7%) compared to 2024, respectively.

  • In 2025, imports supplied 26.3% of California’s RPS-eligible renewable energy, with 9.4% from the Northwest and 17.0% from the Southwest.

  • The share of Northwest imports that are from RPS-eligible renewables remained somewhat elevated at 56.9% in 2025 compared to 68.5% in 2024, while the share from the Southwest rose from 39.7% in 2024 to 48.9% in 2025.

  • Electricity generation from RPS-eligible renewable sources and large hydroelectric accounted for 56.4% of the power mix in 2025, an increase of 4.1% from 2024. Meanwhile, generation from fossil fuels fell to 32.1% in 2025, a drop of 4.2% and the lowest share of the power mix on record as well as half of 2008’s 63.9%.

  • California added 1.49 gigawatts (GW) of utility-scale capacity to the grid in 2025, of which 100% were RPS-eligible renewable projects, including 1.45 GW of solar, 30.7 MW of wind, and 4.9 MW of biomass. On the other hand, California retired 358.4 MW of capacity across several technologies, of which 313.9 MW (87.6%) were RPS-eligible renewables.

  • California’s power mix totaled 267,661 GWh in 2025, a drop of 10,677 GWh (-3.8%) from 2024 and the lowest on record. Not only does this mean Californians are consuming less electricity, the electricity not consumed has also been displacing electricity generation from natural gas.

Renewable Portfolio Standards (RPS) and Community Choice Aggregators (CCAs)
  • Renewable or clean energy mandates are in effect in 27 states and Washington, D.C. Three of these states (Hawaii, Rhode Island, and Vermont) plus Washington, D.C. have a 100% RPS goal.

  • California is one of the 16 states with RPS targets of at least 50% of retail electricity sales. Sixteen states including California have also established a broader 100% Clean Electricity Standard (CES).

  • After narrowly missing the interim SB 100 goal of procuring 44% of retail electricity sales from RPS-eligible renewable sources by the end of 2024, it would be a close call whether California will meet the interim 2026 goal of 50%.

  • However, California’s share of RPS-eligible renewable sources to the state’s power mix rose by 4.0% from 2024 to 2025 after rising 4.4% from 2023 to 2024 — the fastest pace on record. At the current pace, California should be able to meet its next interim goal of 52% by 2027 even if it misses the 2026 goal.

  • In 2025, California had 25 Community Choice Aggregations (CCAs) that served load and procured RPS-eligible energy. Total forecasted annual load in CCAs in California increased by 19.2% from 2024 to 2026, totaling 72,997 GWh in 2026.

  • These CCAs are on track to meet or exceed the overall RPS requirements for the 2025-2027 compliance period (47% to 52%).

Distributed Energy Resources and Renewable Energy Curtailment
  • After tepid results in 2024, 2025 was an improvement for interconnected distributed capacity of solar, wind, and energy storage within the three investor-owned utilities service territories, totaling 1,952 MW (in alternating current), up 13.4% from 2024.

  • Residential continues to be the largest sector, accounting for 59.5% of the interconnected solar, wind, and energy storage installed (1,162 MW) in 2025. The commercial sector was the next largest sector (28.9%) and the industrial sector accounted for 3.0% of the interconnected distributed capacity.

  • Solar PV (standalone and hybrid systems where solar PV is the primary technology) accounted for most of the interconnected distributed capacity, totaling 1,744 MW in 2025, an increase of 9.2% compared to 2024.

  • Energy storage (standalone and hybrid systems where energy storage is the primary technology) reached 208 MW in 2025, an increase of 66.6% compared to 2024.

  • In California, small-scale solar PV net generation totaled 34,529 GWh in 2025, up 2,806 GWh or 8.8% from 2024. California accounted for 37.1% of all small-scale solar PV net generation nationwide in 2025, down slightly compared to 2024 (37.5%).

  • By sector, California accounted for 30.4% in the commercial sector, 37.2% in the residential sector, and 67.8% in the industrial sector.

  • Small scale solar PV generation grew slightly slower, percentage wise, in California (+8.8%) than the rest of the U.S. (+10.7%) from 2024 to 2025.

  • California added 31 MW but also retired 60 MW of wind capacity in 2025, resulting in a net decrease of 29 MW in cumulative wind capacity compared to 2024.

  • In the first eight months of 2026, curtailment totaled 4,948 GWh electricity generated (322 GWh from wind and 4,627 GWh from solar), which is 51.3% more than the total curtailment of 3,271 GWh in the first eight months of 2025.

  • Wind and solar curtailments rose by 23.3% and 53.7%, respectively, during the first eight months of 2026 relative to the first eight months of 2025. The unusually high level of solar curtailment occurred in April and May 2026.

  • For the first time, solar curtailment exceeded more than ten percent of generation (10.7%), which was noticeably higher than 2025 (6.1% for the full year and 7.2% for the first eight months).

  • Wind curtailment totaled 1.7% of CAISO’s generation from wind for the first eight months of 2026, which was also higher than 2025 (1.3% for the full year and 1.5% for the first eight months).

Energy Storage and Capacity
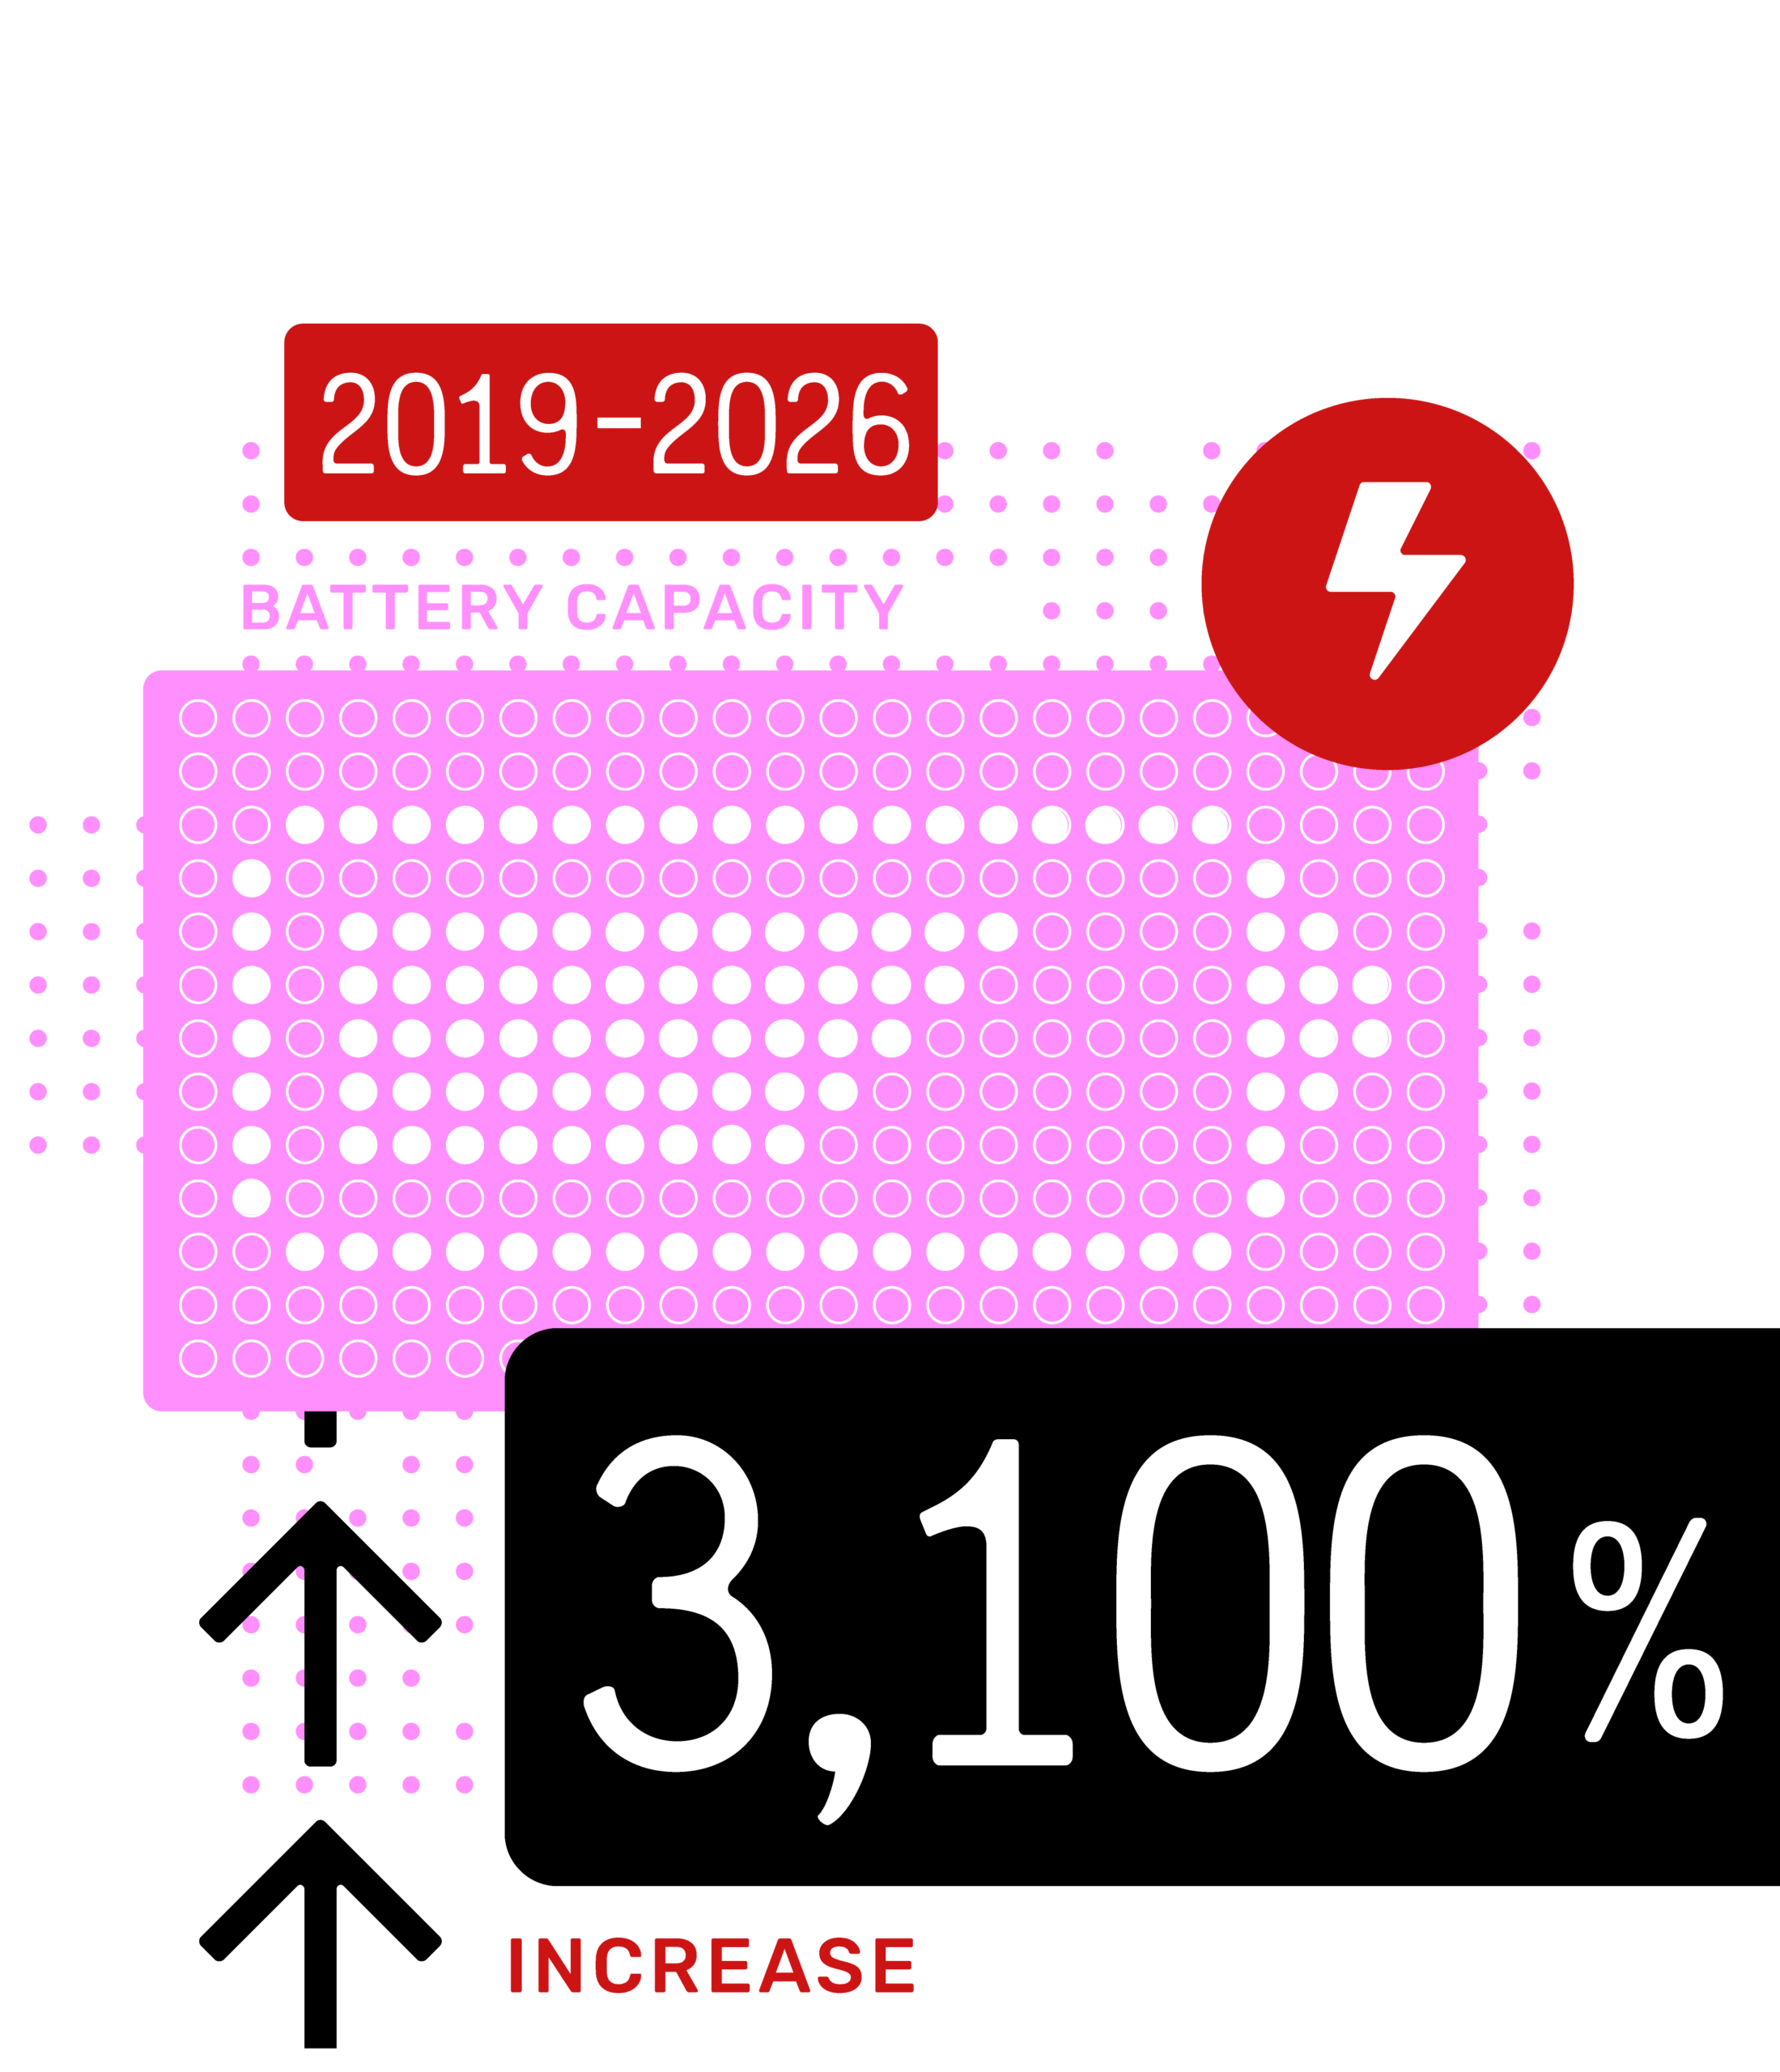
  • In 2025, California approved 5,575 MW of energy storage, exceeding 20,000 MW cumulatively for the first time.

  • 4,536 MW of that came from the utility-scale sector, with the remaining 952 MW from the residential sector and 87.4 MW from the commercial sector.

  • As of June 15, 2026, California has approved another 8,647 MW in 2026 year-to-date.

  • In 2025, California added 3,388 MW of nameplate capacity energy storage while the rest of the U.S. added 12,792 MW. Compared to 2024, energy storage capacity addition fell 10.3% in California and grew 75.6% in the rest of the U.S.

  • Most of the energy storage systems that came online in 2025 are composed of lithium-ion (Li-ion) batteries (96.7% nationwide), which have a longer average duration in California (3.2 hours) than the rest of the U.S. (2.8 hours).

  • Systems with a duration of four hours were the most common in California, accounting for 61.7% (2,091 MW) of the state’s capacity addition in 2025.

  • As of the end of 2025, California has 11,052 MW of proposed energy storage capacity in the pipeline for 2026 to 2031 while the rest of the U.S. has 57,380 MW of proposed energy storage capacity in the pipeline.

  • The prevalence of lithium-ion battery projects across the state expanded considerably in 2025, with 31 counties in California hosting these installations within their respective territories.

  • Recent CAISO reforms have halted the interconnection queue in 2025; the projects that were sited in California and entered the queue were outside of CAISO’s territory. As of the end of 2025, just 1.4 GW of total generation and storage capacity were seeking connection to the grid in California.

  • On the other hand, 101 projects totalling 39 GW were withdrawn in 2025. Most of these withdrawn projects previously sought interconnection during CAISO’s Clusters 11 to 15 windows.

  • Overall active queue volume decreased from 248.7 GW from the end of 2024 to 177.9 GW by the end of 2025, representing a drop of 28.5%. Meanwhile, projects withdrawn from the interconnection queue totaled 571.6 GW, up 73.4 GW or 14.7% from the end of 2024.

  • Active queue volume fell for most technologies except for standalone solar (+9.7%), gas (+5.3%), and other (+1,622.2%).

  • Solar and battery hybrid projects totaled 100 GW in 2025 and made up over half of the active queue volume (56.3%), followed by standalone battery projects (29.2%), wind and battery hybrid projects (3.9%), and standalone solar projects (3.1%).

Energy Transition in Residential Buildings
  • In 2024, about 158,000 households in California used solar as the main heating fuel, up 12.4% from 2023 compared to the 15.8% growth year-over-year nationwide.

  • In 2024, California had the second-highest share of households in which solar was the main heating fuel (1.2%), behind only Hawaii (4.7%) and quadrupled the share nationwide (0.3%).

  • Homeowners are more likely to have solar as the main fuel heating source than renters. In 2024, solar made up 2.3% of owner-occupied households and just 0.4% of renter-occupied households.

  • Solar as home heating fuel grew 15.2% among owner-occupied households and 12.0% among renter-occupied households from 2023 to 2024.

  • Solar adoption varies considerably across counties in California, with several small counties by population punching above their weights. In 2024, San Benito County had the highest adoption rate (3.7%), followed by Madera County (3.0%) and Amador County (3.0%).

  • Parts of Fresno County and San Diego County emerge as notable hotspots with high solar adoption among owner-occupied households. East Central Fresno City topped the list with 10.8% of owner-occupied households using solar as the main heating fuel in 2023, followed by Selma, Kerman, and Coalinga areas in Fresno County (9.6%), Southeast/Encanto and Skyline areas of San Diego City (8.0%).

Footnotes

54 SB-1020 Clean Energy, Jobs, and Affordability Act of 2022. Available at: https://leginfo.legislature.ca.gov/faces/billNavClient.xhtml?bill_id=202120220SB1020

55 AB-1373 Energy. Available at: https://leginfo.legislature.ca.gov/faces/billTextClient.xhtml?bill_id=202320240AB1373

56 “Trump Administration Renews Effort to Block the Nearly Completed Revolution Wind.” Sierra Club. October 18, 2026. Available at: https://www.sierraclub.org/sierra/trump-administration-renews-effort-block-nearly-completed-revolution-wind?amp

57 “California challenges Trump administration’s wasteful, taxpayer-funded offshore wind buyout.” Environmental Defense Fund. August 24, 2026. Available at: https://www.edf.org/media/california-challenges-trump-administrations-wasteful-taxpayer-funded-offshore-wind-buyout

58 “States sue Trump administration, developers over offshore wind lease buyouts.” Utility Dive. September 24, 2026. Available at: https://www.utilitydive.com/news/states-sue-trump-administration-developers-over-offshore-wind-lease-buyout/831279/

59 “Effects of HR1 on commercial, utility US solar markets.” Solar Power World. July 18, 2025. Available at: https://www.solarpowerworldonline.com/2025/07/effects-of-hr1-on-commercial-utility-us-solar-markets/

60 “PG&E: 3.5GW of data center capacity in California’s connection pipeline over next five years.” Data Center Dynamics. June 24, 2024. Available at: https://www.datacenterdynamics.com/en/news/pge-35gw-of-data-center-capacity-in-connection-pipeline-over-next-five-years/

61 Renewable Portfolio Standard eligible sources include biomass, geothermal, solar, wind, and small hydroelectric facilities. Small hydroelectric projects are hydroelectric projects that are less than 30 MW of generation capacity.