
Data Source: California Air Resources Board, California Greenhouse Gas Inventory - by Scoping Plan
Analysis by Beacon Economics
Highlight
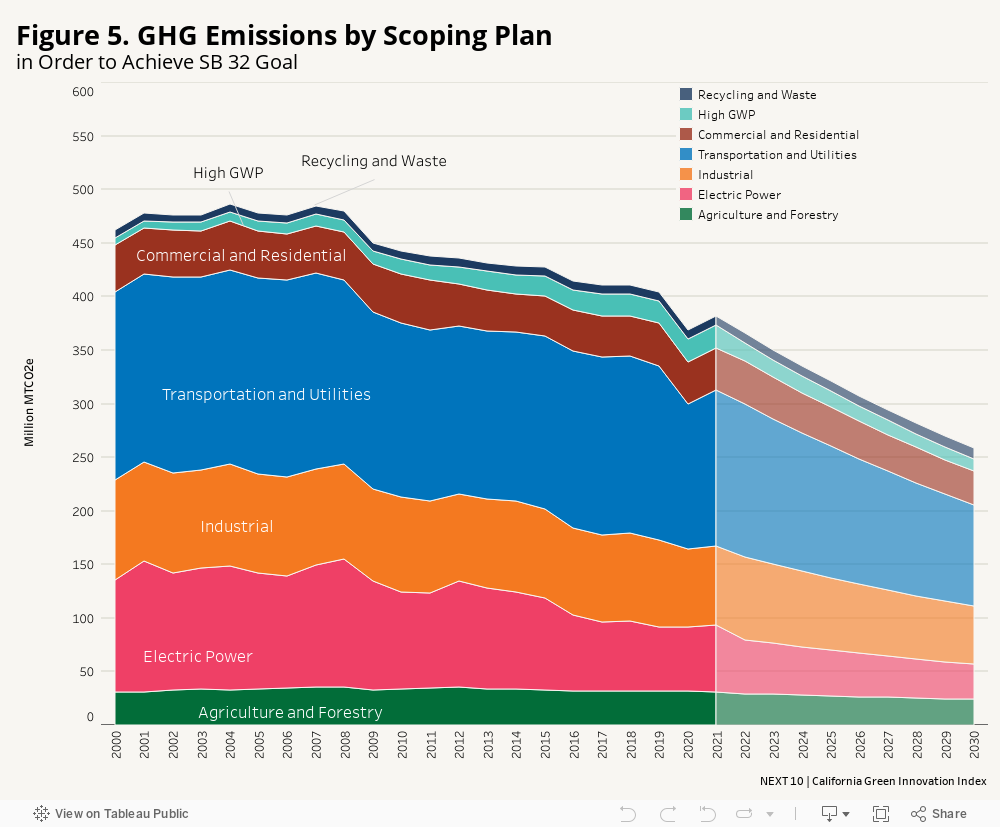
- An examination of each sector's objectives was conducted, followed by the calculation of the Compound Annual Growth Rate (CAGR) necessary to attain the 2030 targets. Subsequently, the sectors were ranked in descending order based on the required annual average rate of reduction from 2021 to 2030, required to reach each sector's designated 2030 emission goal. The commercial and residential (-2.4% each year) and agriculture (-2.8% each year) sectors are most likely to meet the 2030 GHG emission reduction goal on time. The electric power sector needs the largest average annual reduction (-6.9%), followed by high GWP sector (-6.6%), transportation and utilities sector (-4.6%), industrial sector (-3.4%). For recycling & waste, the GHG emissions are low. While there have been some fluctuations, the general direction is slightly upward every year. The sector’s emissions have grown from being 7.4 MMTCO2e in 2000 to 9.1 MMTCO2e in 2021.
Challenges
- The annual average rate of change accelerated during recent years, with a jump from 1.0 percent since 2000 to 1.13 percent (2016 to 2021). In the electric power sector, due to ongoing drought (from 2019 to 2021) threatening the electricity grid’s reliability. Electric power emissions increased in 2021 after a small decrease in the imports sub-sector in 2020. 2021 emissions from this sector are 4.8 percent (+2.8 MMTCO2e) higher than in 2020 and 3.5 percent (+2.1 MMTCO2e) higher than in 2019. The state will likely need significant efforts moving forward just to keep up the pace of GHG emission reductions in the electric power sector. However, with the alleviation of wildfire and drought conditions in 2022, there is a possibility that emissions may begin to decline due to increased electricity generated by hydropower.
- Emissions from the high global warming potential gases (high-GWP) sector—which mainly consist of substitutes of ozone-depleting substances (substitutes for ODS) for refrigeration and air—have been trending in the wrong direction for at least two decades.11 Emissions from high-GWP sector increased by 2.1 times from 2001 (6.9 MMTCO2e) to 2021 (21.3 MMTCO2e). Even though emissions from the high GWP sector remained the same level in 2021 when compared with 2020, they were still 2.7 percent (+0.6 MMTCO2e) higher than the 2019 levels.
- Only the high GWP and electric power sectors (specifically in-state generation) had higher GHG emissions in 2021 compared to 2019. In-state generation of electric power accounted for 42.5 MMTCO2e in 2021, which is 3.9 percent (+1.6 MMTCO2e) higher than in 2020 and 10.2 percent higher (+4.0 MMTCO2e) than in 2019.
11 Other scoping plan categories in the high global warming potential scoping plan sector include conditioning activities, semiconductor manufacturing and sulfur hexafluoride (SF6) released from electricity transmission and distribution. Use of substitutes for ODS is by far the largest GHG emitting high GWP category.
More About
Carbon Economy
Related Content