
Data Source: California Air Resources Board, California Greenhouse Gas Inventory - by Sector and by Sector and Activity; Bureau of Economic Analysis, U.S. Department of Commerce; U.S. Census Bureau
Analysis by Beacon Economics
Highlight
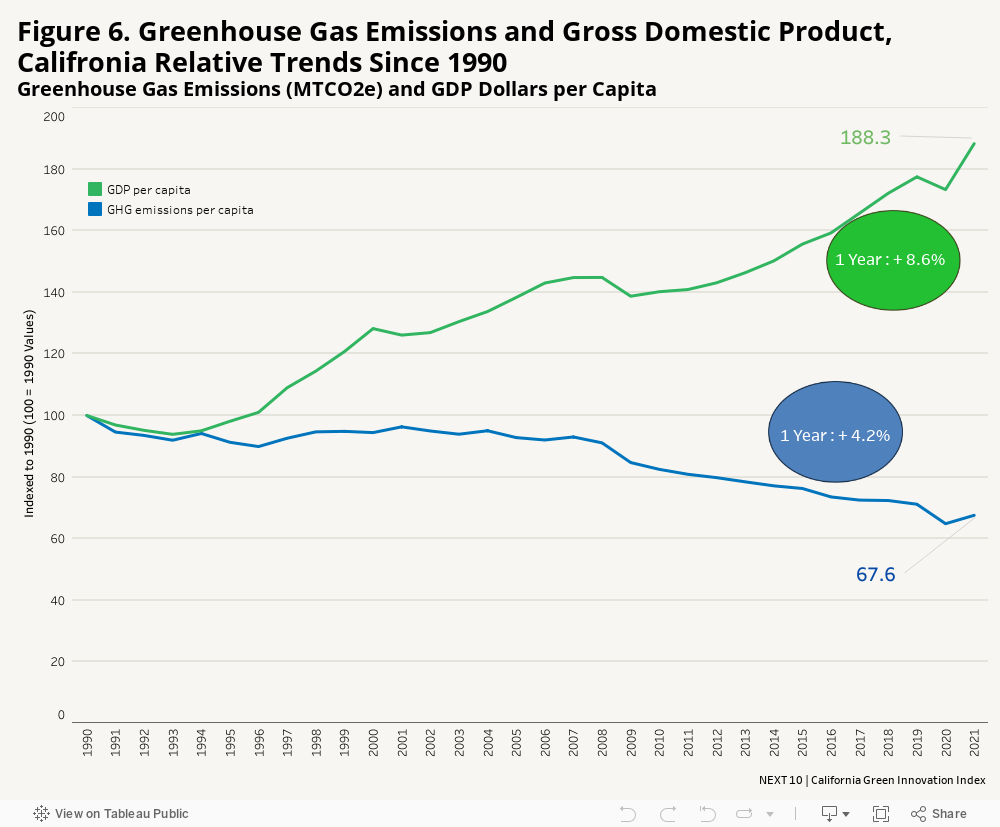
- GHG emissions per capita in 2021 were 9.7 MTCO2e per person in California, an increase of 4.2 percent (+0.4 MTCO2e/person) from 2020 to 2021, while the state’s inflation-adjusted GDP per capita grew by 8.6 percent over the same time period. Compared to pre-pandemic 2019 levels, GHG emissions per capita decreased by 5.1 percent (-0.52 MTCO2e/person), while the inflation-adjusted GDP per capita in 2021 was up by 6.1 percent. Compared to 1990, GHG emissions per capita were down by 32.4 percent (-4.7 MTCO2e/person), while the inflation-adjusted GDP per capita was up by 88.3 percent in 2021. The total emissions annual average decline was 0.4 percent from 1990 to 2021, while per capita emissions declined by 1.25 percent each year during the same period.